29
/
en
AIzaSyAYiBZKx7MnpbEhh9jyipgxe19OcubqV5w
April 1, 2024
137695
Georgia
GEO
true
2
1
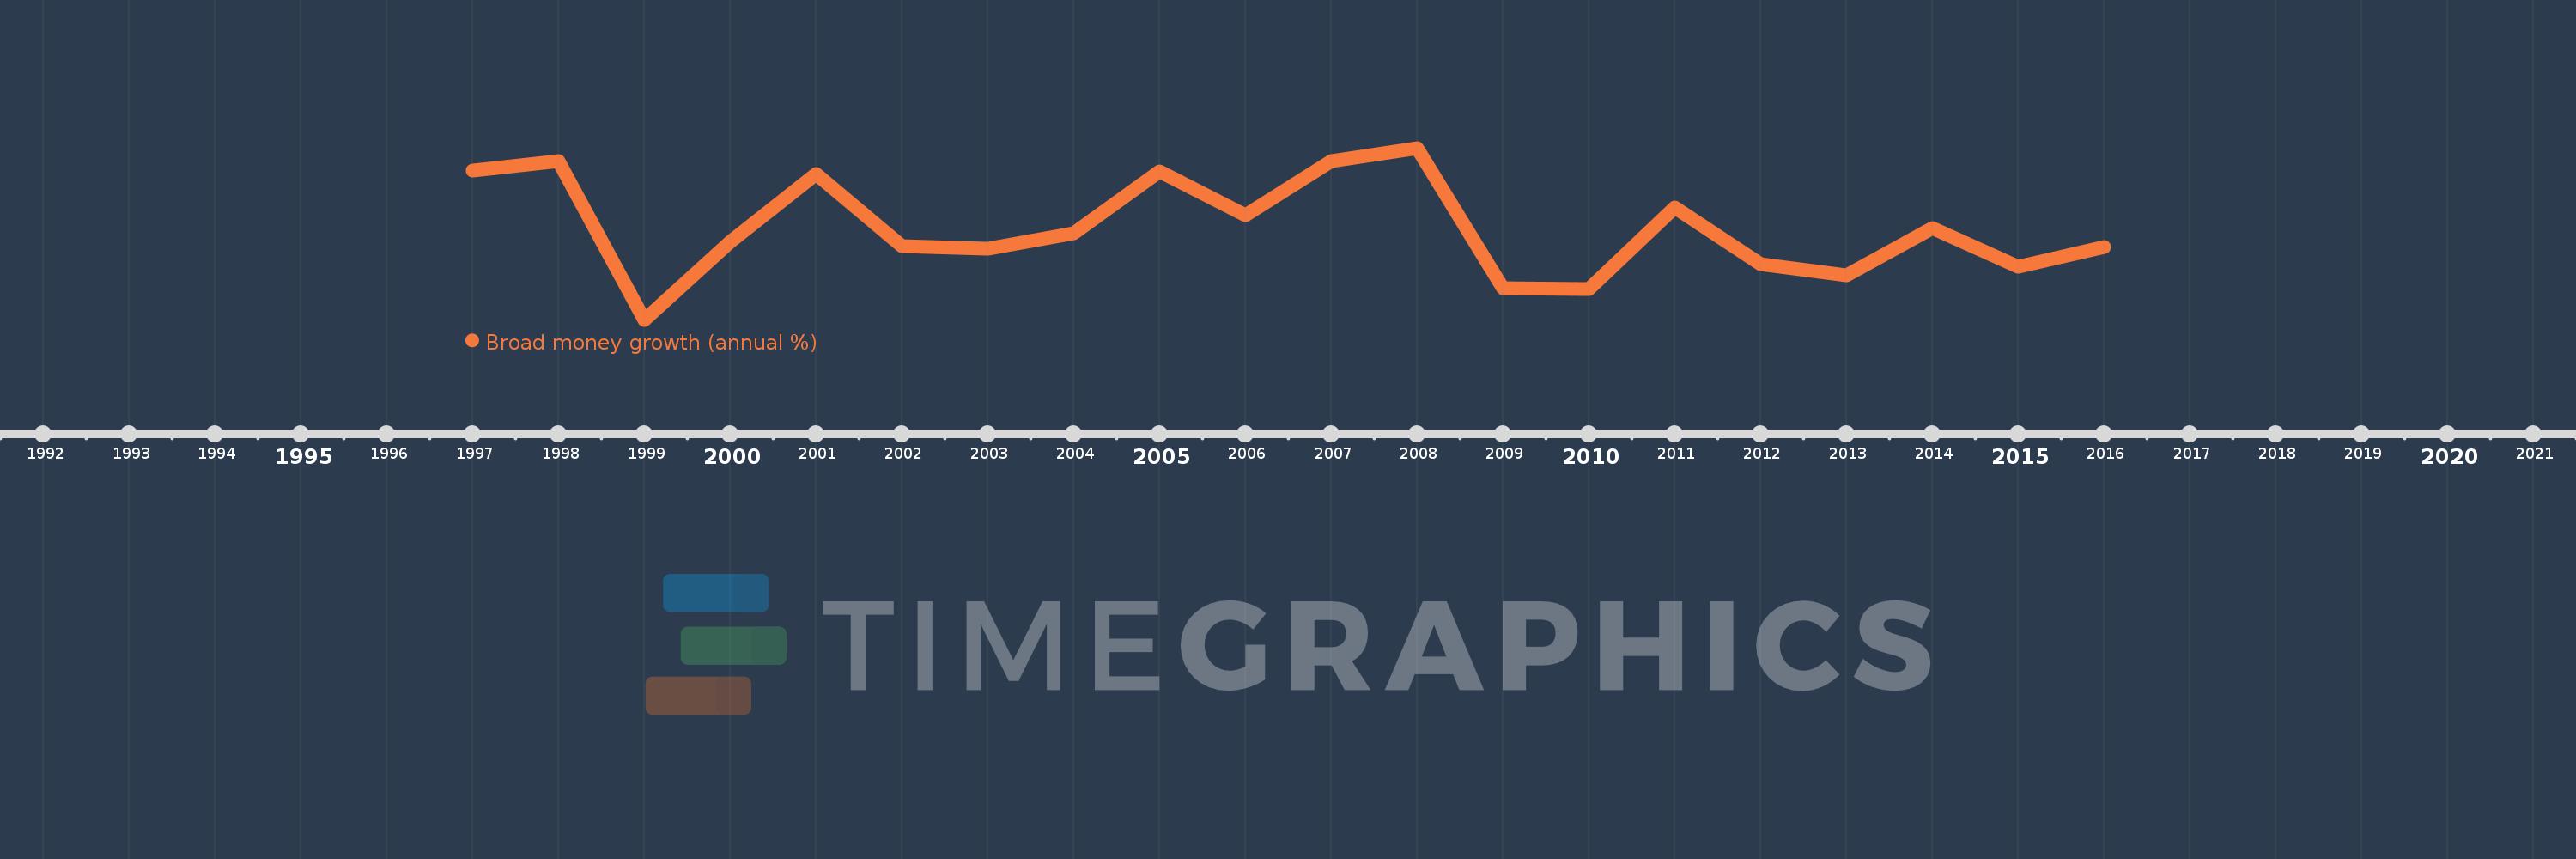
Broad money growth (annual %)
2016,2015,2014,2013,2012,2011,2010,2009,2008,2007,2006,2005,2004,2003,2002,2001,2000,1999,1998,1997
This statistics in other country:
AfghanistanAlbaniaAlgeriaAngolaAntigua and BarbudaArgentinaArmeniaArubaAustraliaAzerbaijanBahamas, TheBahrainBangladeshBarbadosBelarusBelizeBeninBhutanBoliviaBosnia and HerzegovinaBotswanaBrazilBrunei DarussalamBulgariaBurkina FasoBurundiCabo VerdeCambodiaCameroonCanadaCentral African RepublicChadChileChinaColombiaComorosCongo, Dem. Rep.Congo, Rep.Costa RicaCote d'IvoireCroatiaCzech RepublicDenmarkDjiboutiDominicaDominican RepublicEcuadorEgypt, Arab Rep.El SalvadorEquatorial GuineaEritreaEstoniaEthiopiaFijiGabonGambia, TheGeorgiaGhanaGrenadaGuatemalaGuineaGuinea-BissauGuyanaHaitiHondurasHong Kong SAR, ChinaHungaryIcelandIndiaIndonesiaIran, Islamic Rep.IraqIsraelJamaicaJapanJordanKazakhstanKenyaKorea, Rep.KuwaitKyrgyz RepublicLao PDRLatviaLebanonLesothoLiberiaLibyaLithuaniaMacao SAR, ChinaMacedonia, FYRMadagascarMalawiMalaysiaMaldivesMaliMauritaniaMauritiusMexicoMicronesia, Fed. Sts.MoldovaMongoliaMoroccoMozambiqueMyanmarNamibiaNepalNew ZealandNicaraguaNigerNigeriaNorwayOmanPakistanPanamaPapua New GuineaParaguayPeruPhilippinesPolandQatarRomaniaRussian FederationRwandaSamoaSao Tome and PrincipeSaudi ArabiaSenegalSerbiaSeychellesSierra LeoneSingaporeSlovak RepublicSolomon IslandsSouth AfricaSouth SudanSri LankaSt. Kitts and NevisSt. LuciaSt. Vincent and the GrenadinesSudanSurinameSwazilandSwedenSwitzerlandSyrian Arab RepublicTajikistanTanzaniaThailandTimor-LesteTogoTongaTrinidad and TobagoTunisiaTurkeyUgandaUkraineUnited Arab EmiratesUnited KingdomUnited StatesUruguayVanuatuVenezuela, RBVietnamWest Bank and GazaYemen, Rep.ZambiaZimbabwe Timeline:
This timeline shows a graph from 1997 to 2016 of Georgia. No data until 1996. Number of actual observations by date: 20.
Source name:
World Development Indicators
Source organization:
International Monetary Fund, International Financial Statistics and data files.
Categories, topics:
Financial Sector
Last updated:
apr 23, 2017
Indicators value changes by year
Minimum:
-0.787
jan 1, 1999
Maximum:
46.399
jan 1, 2008
At the date of observation
Value
Absolute change
Change from previous value
jan 1, 1997
40.232
+40.232
0.0%
jan 1, 1998
42.777
+2.545
6.33%
jan 1, 1999
-0.787
-43.564
-101.84%
jan 1, 2000
20.575
+21.362
-2.72K%
jan 1, 2001
39.173
+18.598
90.39%
jan 1, 2002
19.431
-19.742
-50.4%
jan 1, 2003
18.814
-0.617
-3.17%
jan 1, 2004
23.062
+4.248
22.58%
jan 1, 2005
40.03
+16.968
73.58%
jan 1, 2006
27.851
-12.179
-30.42%
jan 1, 2007
42.736
+14.885
53.44%
jan 1, 2008
46.399
+3.663
8.57%
jan 1, 2009
7.876
-38.523
-83.02%
jan 1, 2010
7.733
-0.144
-1.83%
jan 1, 2011
30.133
+22.4
289.69%
jan 1, 2012
14.499
-15.634
-51.88%
jan 1, 2013
11.355
-3.143
-21.68%
jan 1, 2014
24.455
+13.1
115.37%
jan 1, 2015
13.757
-10.698
-43.75%
jan 1, 2016
19.25
+5.493
39.93%
Ranking of countries by current statistics by years


Comments: