29
/
en
AIzaSyAYiBZKx7MnpbEhh9jyipgxe19OcubqV5w
April 1, 2024
196506
Micronesia, Fed. Sts.
FSM
true
2
1
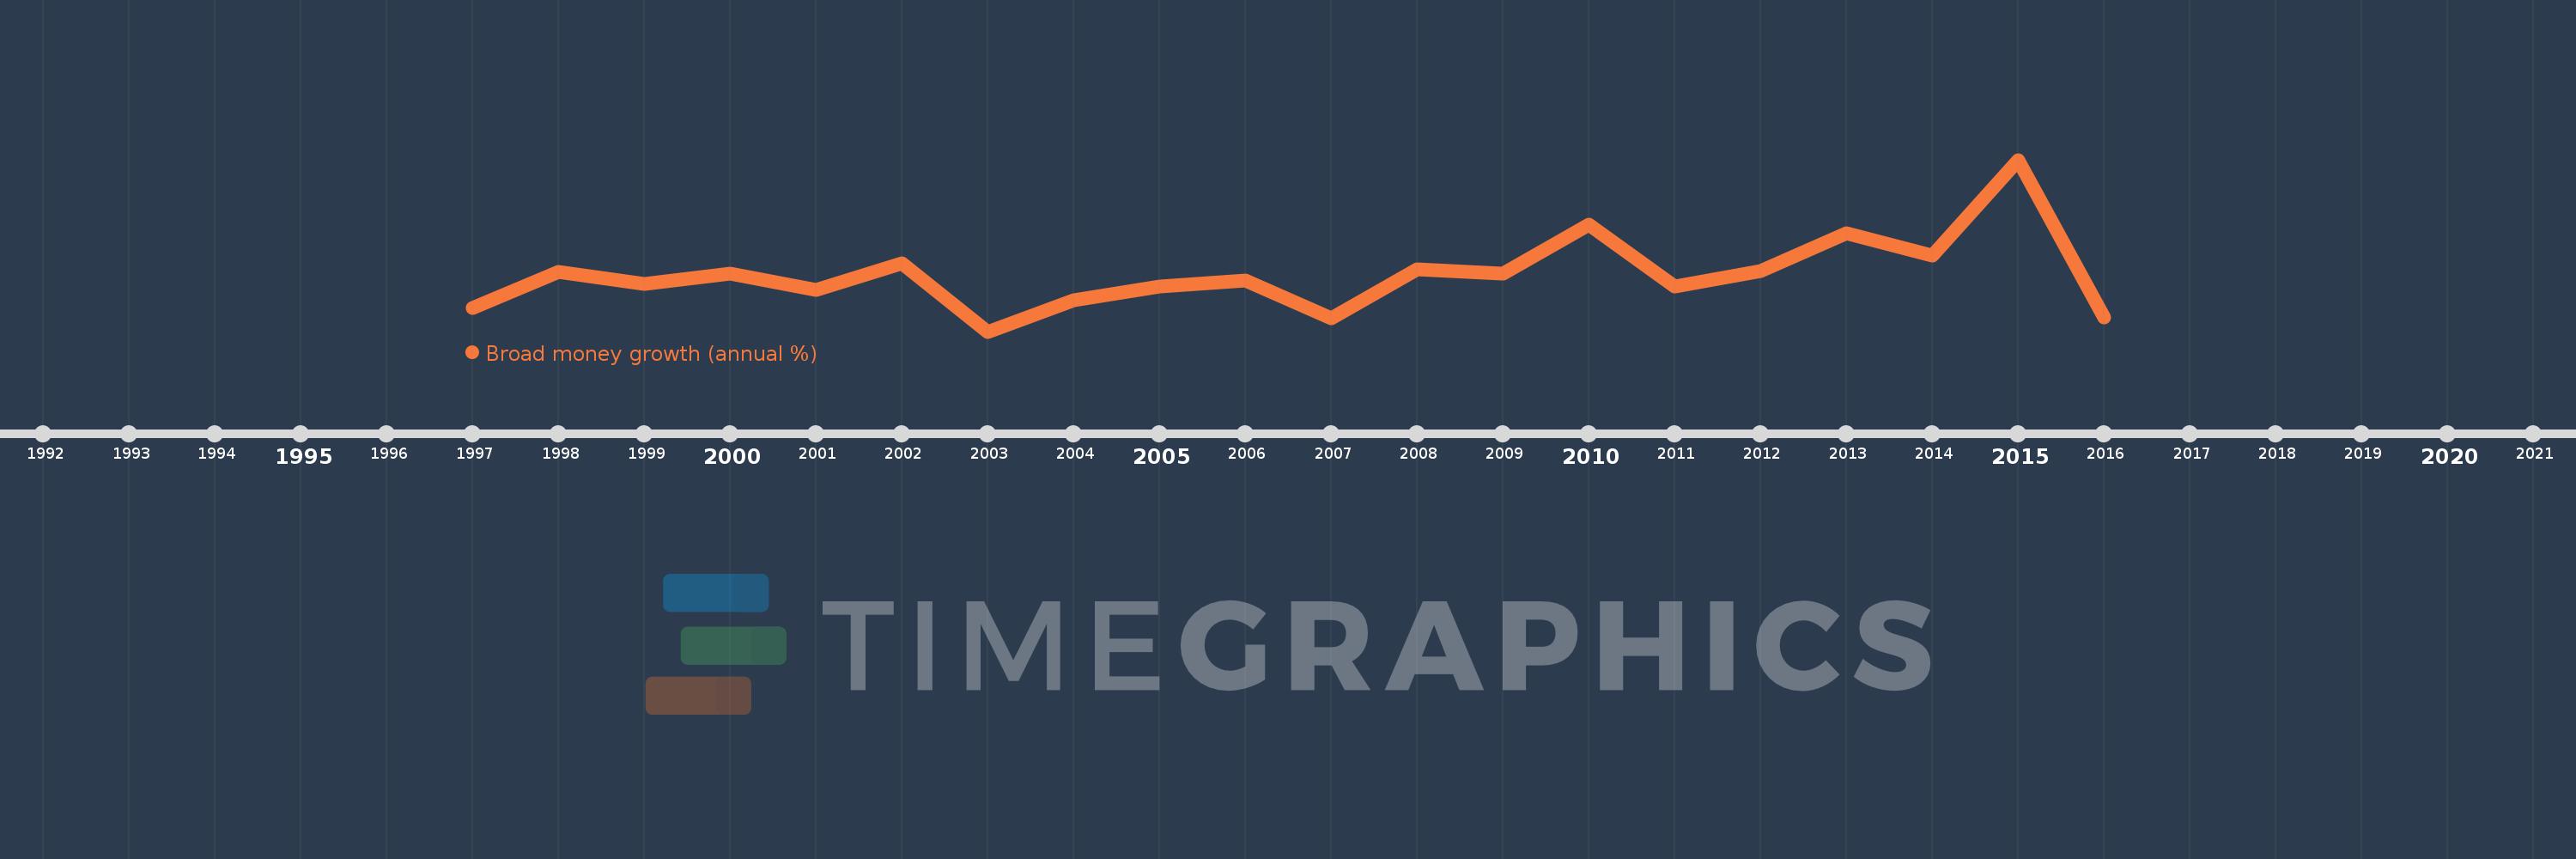
Broad money growth (annual %)
2016,2015,2014,2013,2012,2011,2010,2009,2008,2007,2006,2005,2004,2003,2002,2001,2000,1999,1998,1997
This statistics in other country:
AfghanistanAlbaniaAlgeriaAngolaAntigua and BarbudaArgentinaArmeniaArubaAustraliaAzerbaijanBahamas, TheBahrainBangladeshBarbadosBelarusBelizeBeninBhutanBoliviaBosnia and HerzegovinaBotswanaBrazilBrunei DarussalamBulgariaBurkina FasoBurundiCabo VerdeCambodiaCameroonCanadaCentral African RepublicChadChileChinaColombiaComorosCongo, Dem. Rep.Congo, Rep.Costa RicaCote d'IvoireCroatiaCzech RepublicDenmarkDjiboutiDominicaDominican RepublicEcuadorEgypt, Arab Rep.El SalvadorEquatorial GuineaEritreaEstoniaEthiopiaFijiGabonGambia, TheGeorgiaGhanaGrenadaGuatemalaGuineaGuinea-BissauGuyanaHaitiHondurasHong Kong SAR, ChinaHungaryIcelandIndiaIndonesiaIran, Islamic Rep.IraqIsraelJamaicaJapanJordanKazakhstanKenyaKorea, Rep.KuwaitKyrgyz RepublicLao PDRLatviaLebanonLesothoLiberiaLibyaLithuaniaMacao SAR, ChinaMacedonia, FYRMadagascarMalawiMalaysiaMaldivesMaliMauritaniaMauritiusMexicoMicronesia, Fed. Sts.MoldovaMongoliaMoroccoMozambiqueMyanmarNamibiaNepalNew ZealandNicaraguaNigerNigeriaNorwayOmanPakistanPanamaPapua New GuineaParaguayPeruPhilippinesPolandQatarRomaniaRussian FederationRwandaSamoaSao Tome and PrincipeSaudi ArabiaSenegalSerbiaSeychellesSierra LeoneSingaporeSlovak RepublicSolomon IslandsSouth AfricaSouth SudanSri LankaSt. Kitts and NevisSt. LuciaSt. Vincent and the GrenadinesSudanSurinameSwazilandSwedenSwitzerlandSyrian Arab RepublicTajikistanTanzaniaThailandTimor-LesteTogoTongaTrinidad and TobagoTunisiaTurkeyUgandaUkraineUnited Arab EmiratesUnited KingdomUnited StatesUruguayVanuatuVenezuela, RBVietnamWest Bank and GazaYemen, Rep.ZambiaZimbabwe Timeline:
This timeline shows a graph from 1997 to 2016 of Micronesia, Fed. Sts.. No data until 1996. Number of actual observations by date: 20.
Source name:
World Development Indicators
Source organization:
International Monetary Fund, International Financial Statistics and data files.
Categories, topics:
Financial Sector
Last updated:
apr 23, 2017
Indicators value changes by year
Minimum:
-11.97
jan 1, 2003
Maximum:
33.347
jan 1, 2015
At the date of observation
Value
Absolute change
Change from previous value
jan 1, 1997
-5.786
-5.786
0.0%
jan 1, 1998
3.805
+9.591
-165.77%
jan 1, 1999
0.717
-3.088
-81.16%
jan 1, 2000
3.389
+2.672
372.8%
jan 1, 2001
-0.956
-4.345
-128.21%
jan 1, 2002
5.97
+6.926
-724.35%
jan 1, 2003
-11.97
-17.94
-300.52%
jan 1, 2004
-3.745
+8.225
-68.71%
jan 1, 2005
-0.056
+3.689
-98.5%
jan 1, 2006
1.613
+1.669
-2.96K%
jan 1, 2007
-8.456
-10.069
-624.39%
jan 1, 2008
4.566
+13.023
-154.0%
jan 1, 2009
3.226
-1.34
-29.35%
jan 1, 2010
16.283
+13.057
404.71%
jan 1, 2011
-0.064
-16.347
-100.39%
jan 1, 2012
3.946
+4.01
-6.26K%
jan 1, 2013
13.874
+9.928
251.59%
jan 1, 2014
8.136
-5.738
-41.36%
jan 1, 2015
33.347
+25.211
309.86%
jan 1, 2016
-8.289
-41.636
-124.86%
Ranking of countries by current statistics by years


Comments: