29
/
en
AIzaSyAYiBZKx7MnpbEhh9jyipgxe19OcubqV5w
April 1, 2024
125171
Egypt, Arab Rep.
EGY
true
2
1
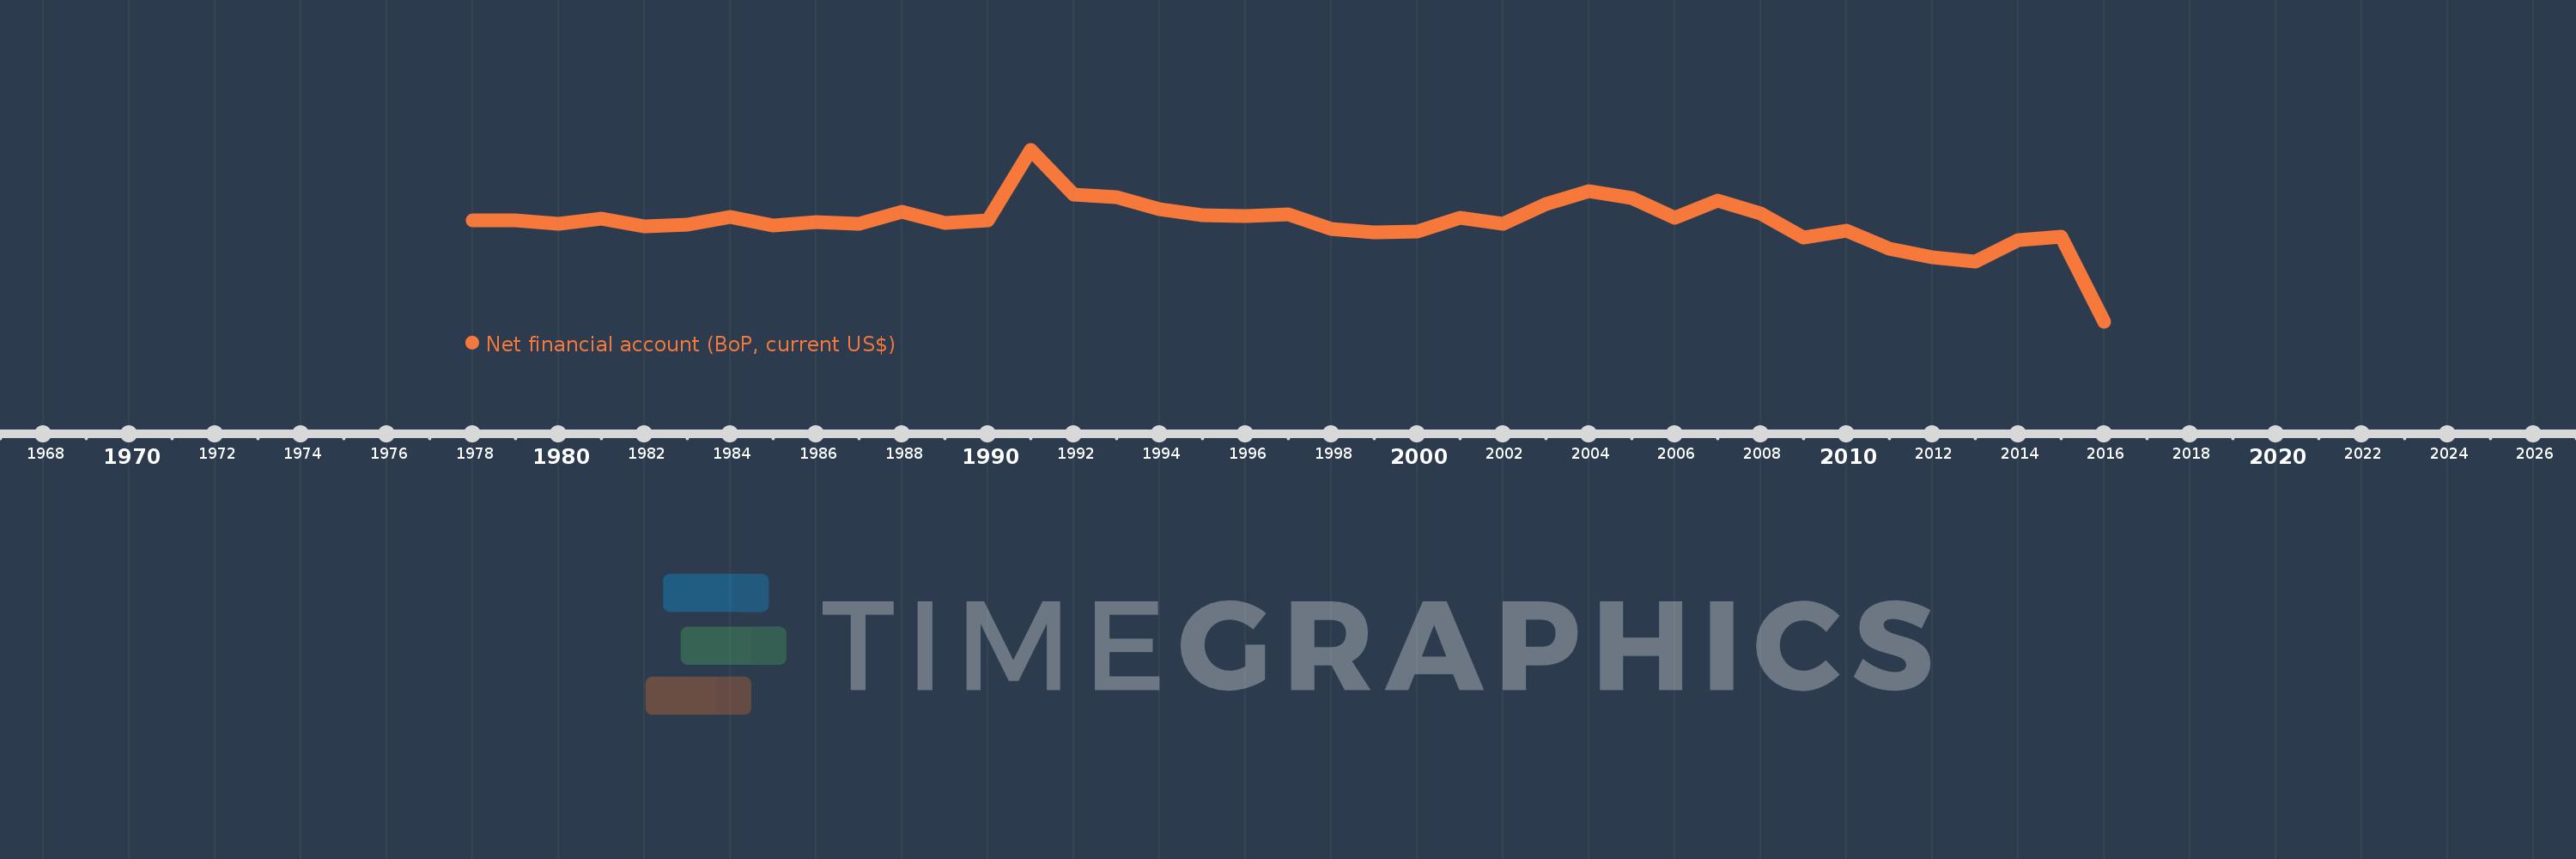
Net financial account (BoP, current US$)
2016,2015,2014,2013,2012,2011,2010,2009,2008,2007,2006,2005,2004,2003,2002,2001,2000,1999,1998,1997,1996,1995,1994,1993,1992,1991,1990,1989,1988,1987,1986,1985,1984,1983,1982,1981,1980,1979,1978
This statistics in other country:
AfghanistanAlbaniaAlgeriaAngolaAntigua and BarbudaArgentinaArmeniaArubaAustraliaAustriaAzerbaijanBahamas, TheBahrainBangladeshBarbadosBelarusBelgiumBelizeBeninBermudaBhutanBoliviaBosnia and HerzegovinaBotswanaBrazilBrunei DarussalamBulgariaBurkina FasoBurundiCabo VerdeCambodiaCameroonCanadaCentral African RepublicChadChileChinaColombiaComorosCongo, Dem. Rep.Congo, Rep.Costa RicaCote d'IvoireCroatiaCuracaoCyprusCzech RepublicDenmarkDjiboutiDominicaDominican RepublicEcuadorEgypt, Arab Rep.El SalvadorEquatorial GuineaEritreaEstoniaEthiopiaEuro areaFijiFinlandFranceFrench PolynesiaGabonGambia, TheGeorgiaGermanyGhanaGreeceGrenadaGuatemalaGuineaGuinea-BissauGuyanaHaitiHondurasHong Kong SAR, ChinaHungaryIcelandIndiaIndonesiaIran, Islamic Rep.IraqIrelandIsraelItalyJamaicaJapanJordanKazakhstanKenyaKiribatiKorea, Rep.KosovoKuwaitKyrgyz RepublicLao PDRLatviaLebanonLesothoLiberiaLibyaLithuaniaLuxembourgMacao SAR, ChinaMacedonia, FYRMadagascarMalawiMalaysiaMaldivesMaliMaltaMarshall IslandsMauritaniaMauritiusMexicoMicronesia, Fed. Sts.MoldovaMongoliaMontenegroMoroccoMozambiqueMyanmarNamibiaNepalNetherlandsNew CaledoniaNew ZealandNicaraguaNigerNigeriaNorwayOmanPakistanPalauPanamaPapua New GuineaParaguayPeruPhilippinesPolandPortugalQatarRomaniaRussian FederationRwandaSamoaSao Tome and PrincipeSaudi ArabiaSenegalSerbiaSeychellesSierra LeoneSingaporeSint Maarten (Dutch part)Slovak RepublicSloveniaSolomon IslandsSouth AfricaSouth SudanSpainSri LankaSt. Kitts and NevisSt. LuciaSt. Vincent and the GrenadinesSudanSurinameSwazilandSwedenSwitzerlandSyrian Arab RepublicTajikistanTanzaniaThailandTimor-LesteTogoTongaTrinidad and TobagoTunisiaTurkeyTuvaluUgandaUkraineUnited KingdomUnited StatesUruguayVanuatuVenezuela, RBVietnamWest Bank and GazaYemen, Rep.ZambiaZimbabwe Timeline:
This timeline shows a graph from 1978 to 2016 of Egypt, Arab Rep.. No data until 1977. Number of actual observations by date: 39.
Source name:
World Development Indicators
Source organization:
International Monetary Fund, Balance of Payments Statistics Yearbook and data files.
Categories, topics:
Economy & Growth
Last updated:
apr 23, 2017
Indicators value changes by year
Minimum:
-21.681 bln
jan 1, 2016
Maximum:
13.559 bln
jan 1, 1991
At the date of observation
Value
Absolute change
Change from previous value
jan 1, 1978
-751.843 mln
-751.843 mln
0.0%
jan 1, 1979
-909.776 mln
-157.933 mln
21.01%
jan 1, 1980
-1.508 bln
-597.938 mln
65.72%
jan 1, 1981
-409.571 mln
+1.098 bln
-72.83%
jan 1, 1982
-2.032 bln
-1.622 bln
396.02%
jan 1, 1983
-1.721 bln
+310.286 mln
-15.27%
jan 1, 1984
-187.857 mln
+1.533 bln
-89.09%
jan 1, 1985
-1.864 bln
-1.676 bln
892.4%
jan 1, 1986
-1.228 bln
+636.0 mln
-34.11%
jan 1, 1987
-1.604 bln
-375.286 mln
30.55%
jan 1, 1988
909.714 mln
+2.513 bln
-156.73%
jan 1, 1989
-1.412 bln
-2.322 bln
-255.21%
jan 1, 1990
-918.636 mln
+493.364 mln
-34.94%
jan 1, 1991
13.559 bln
+14.478 bln
-1.58K%
jan 1, 1992
4.418 bln
-9.142 bln
-67.42%
jan 1, 1993
3.849 bln
-569.0 mln
-12.88%
jan 1, 1994
1.438 bln
-2.411 bln
-62.64%
jan 1, 1995
289.0 mln
-1.149 bln
-79.9%
jan 1, 1996
2.0 mln
-287.0 mln
-99.31%
jan 1, 1997
340.0 mln
+338.0 mln
16.9K%
jan 1, 1998
-2.585 bln
-2.925 bln
-860.39%
jan 1, 1999
-3.288 bln
-702.69 mln
27.18%
jan 1, 2000
-3.193 bln
+95.3 mln
-2.9%
jan 1, 2001
-384.0 mln
+2.809 bln
-87.97%
jan 1, 2002
-1.537 bln
-1.153 bln
300.23%
jan 1, 2003
2.528 bln
+4.065 bln
-264.48%
jan 1, 2004
5.199 bln
+2.671 bln
105.68%
jan 1, 2005
3.796 bln
-1.403 bln
-26.99%
jan 1, 2006
-368.0 mln
-4.164 bln
-109.69%
jan 1, 2007
3.233 bln
+3.601 bln
-978.51%
jan 1, 2008
652.1 mln
-2.581 bln
-79.83%
jan 1, 2009
-4.311 bln
-4.963 bln
-761.06%
jan 1, 2010
-2.994 bln
+1.317 bln
-30.56%
jan 1, 2011
-6.688 bln
-3.695 bln
123.43%
jan 1, 2012
-8.386 bln
-1.697 bln
25.38%
jan 1, 2013
-9.251 bln
-864.9 mln
10.31%
jan 1, 2014
-4.933 bln
+4.317 bln
-46.67%
jan 1, 2015
-4.112 bln
+821.2 mln
-16.65%
jan 1, 2016
-21.681 bln
-17.569 bln
427.25%
Ranking of countries by current statistics by years


Comments: