29
/
en
AIzaSyAYiBZKx7MnpbEhh9jyipgxe19OcubqV5w
April 1, 2024
222564
Peru
PER
true
2
1
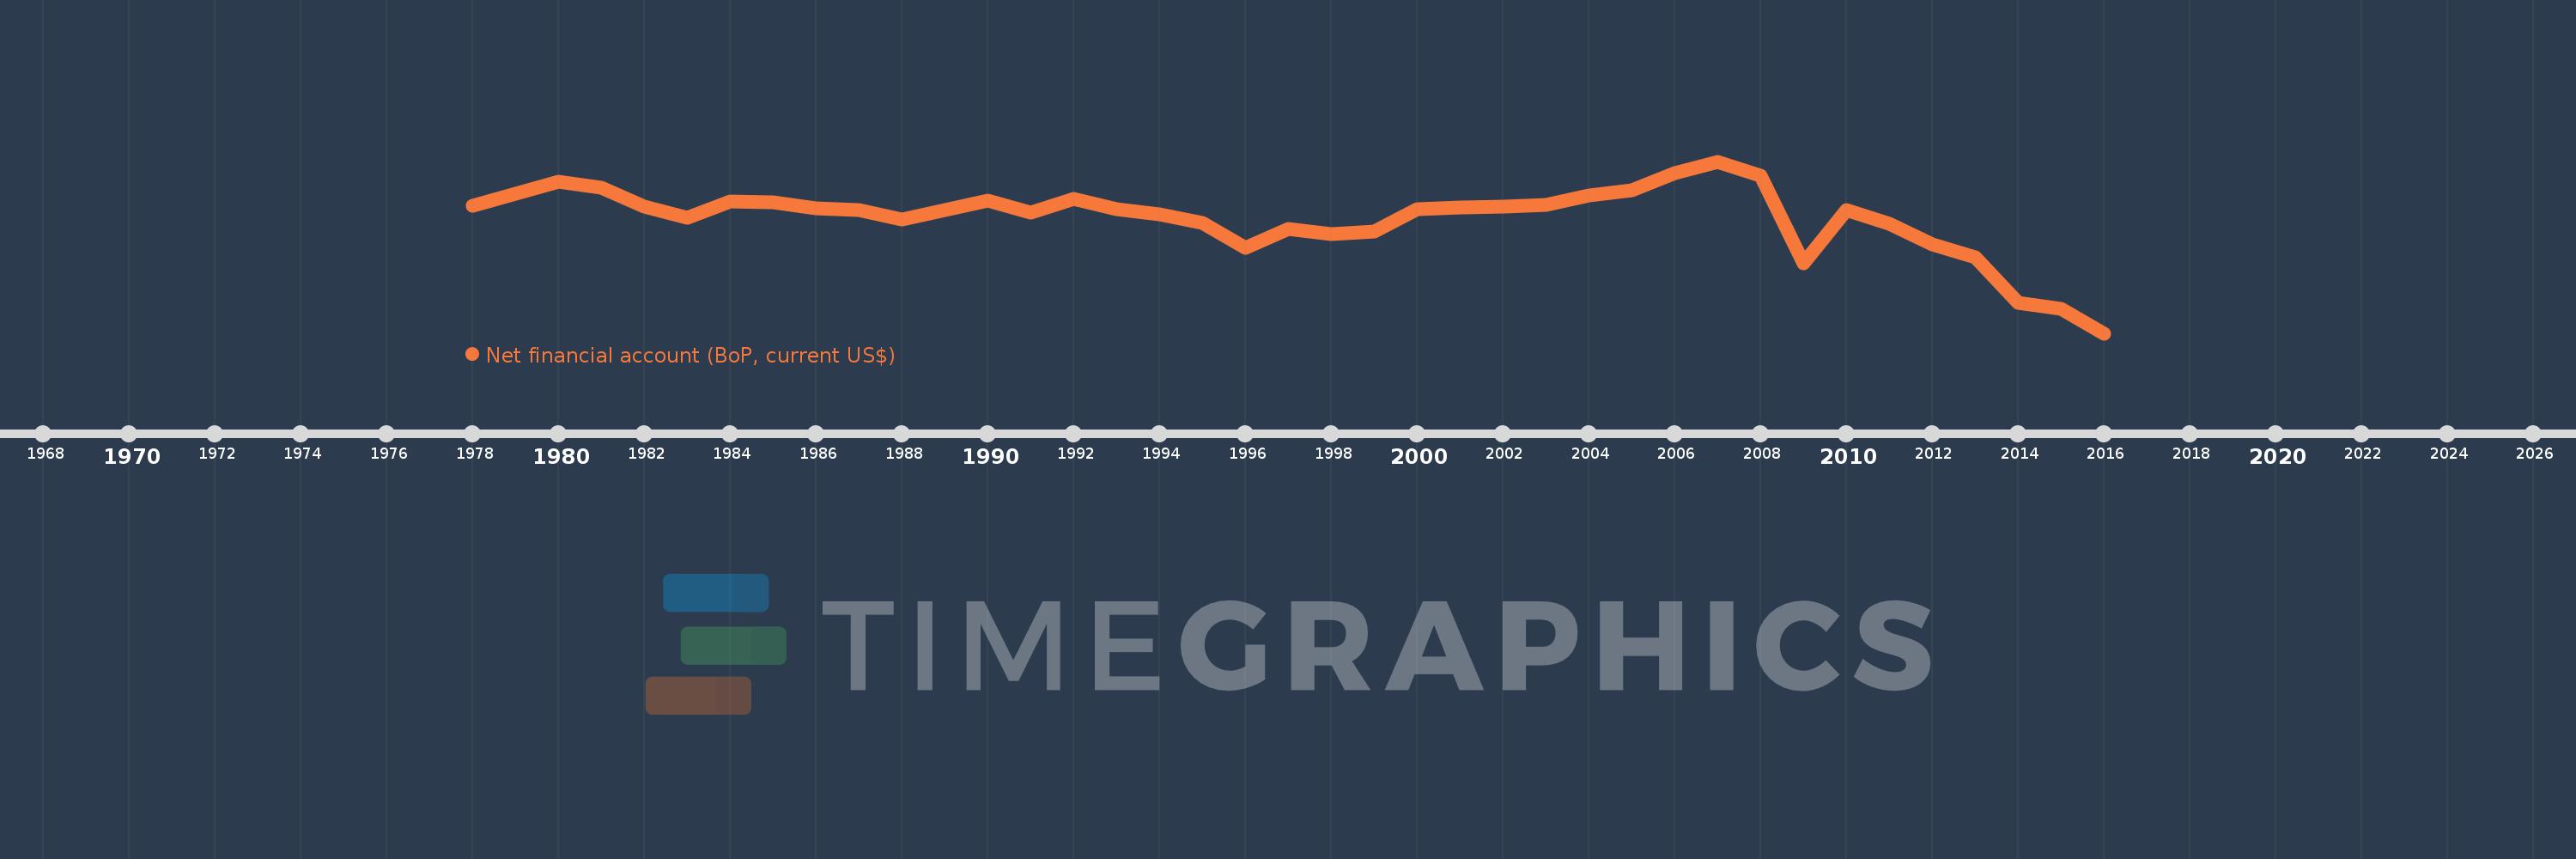
Net financial account (BoP, current US$)
2016,2015,2014,2013,2012,2011,2010,2009,2008,2007,2006,2005,2004,2003,2002,2001,2000,1999,1998,1997,1996,1995,1994,1993,1992,1991,1990,1989,1988,1987,1986,1985,1984,1983,1982,1981,1980,1979,1978
This statistics in other country:
AfghanistanAlbaniaAlgeriaAngolaAntigua and BarbudaArgentinaArmeniaArubaAustraliaAustriaAzerbaijanBahamas, TheBahrainBangladeshBarbadosBelarusBelgiumBelizeBeninBermudaBhutanBoliviaBosnia and HerzegovinaBotswanaBrazilBrunei DarussalamBulgariaBurkina FasoBurundiCabo VerdeCambodiaCameroonCanadaCentral African RepublicChadChileChinaColombiaComorosCongo, Dem. Rep.Congo, Rep.Costa RicaCote d'IvoireCroatiaCuracaoCyprusCzech RepublicDenmarkDjiboutiDominicaDominican RepublicEcuadorEgypt, Arab Rep.El SalvadorEquatorial GuineaEritreaEstoniaEthiopiaEuro areaFijiFinlandFranceFrench PolynesiaGabonGambia, TheGeorgiaGermanyGhanaGreeceGrenadaGuatemalaGuineaGuinea-BissauGuyanaHaitiHondurasHong Kong SAR, ChinaHungaryIcelandIndiaIndonesiaIran, Islamic Rep.IraqIrelandIsraelItalyJamaicaJapanJordanKazakhstanKenyaKiribatiKorea, Rep.KosovoKuwaitKyrgyz RepublicLao PDRLatviaLebanonLesothoLiberiaLibyaLithuaniaLuxembourgMacao SAR, ChinaMacedonia, FYRMadagascarMalawiMalaysiaMaldivesMaliMaltaMarshall IslandsMauritaniaMauritiusMexicoMicronesia, Fed. Sts.MoldovaMongoliaMontenegroMoroccoMozambiqueMyanmarNamibiaNepalNetherlandsNew CaledoniaNew ZealandNicaraguaNigerNigeriaNorwayOmanPakistanPalauPanamaPapua New GuineaParaguayPeruPhilippinesPolandPortugalQatarRomaniaRussian FederationRwandaSamoaSao Tome and PrincipeSaudi ArabiaSenegalSerbiaSeychellesSierra LeoneSingaporeSint Maarten (Dutch part)Slovak RepublicSloveniaSolomon IslandsSouth AfricaSouth SudanSpainSri LankaSt. Kitts and NevisSt. LuciaSt. Vincent and the GrenadinesSudanSurinameSwazilandSwedenSwitzerlandSyrian Arab RepublicTajikistanTanzaniaThailandTimor-LesteTogoTongaTrinidad and TobagoTunisiaTurkeyTuvaluUgandaUkraineUnited KingdomUnited StatesUruguayVanuatuVenezuela, RBVietnamWest Bank and GazaYemen, Rep.ZambiaZimbabwe Timeline:
This timeline shows a graph from 1978 to 2016 of Peru. No data until 1977. Number of actual observations by date: 39.
Source name:
World Development Indicators
Source organization:
International Monetary Fund, Balance of Payments Statistics Yearbook and data files.
Categories, topics:
Economy & Growth
Last updated:
apr 23, 2017
Indicators value changes by year
Minimum:
-10.893 bln
jan 1, 2016
Maximum:
2.366 bln
jan 1, 2007
At the date of observation
Value
Absolute change
Change from previous value
jan 1, 1978
-1.034 bln
-1.034 bln
0.0%
jan 1, 1979
-138.8 mln
+895.5 mln
-86.58%
jan 1, 1980
826.8 mln
+965.6 mln
-695.68%
jan 1, 1981
315.3 mln
-511.5 mln
-61.87%
jan 1, 1982
-1.087 bln
-1.402 bln
-444.75%
jan 1, 1983
-1.992 bln
-905.0 mln
83.26%
jan 1, 1984
-716.0 mln
+1.276 bln
-64.06%
jan 1, 1985
-798.0 mln
-82.0 mln
11.45%
jan 1, 1986
-1.247 bln
-449.0 mln
56.27%
jan 1, 1987
-1.376 bln
-128.6 mln
10.31%
jan 1, 1988
-2.082 bln
-706.4 mln
51.35%
jan 1, 1989
-1.349 bln
+733.0 mln
-35.21%
jan 1, 1990
-681.16 mln
+667.84 mln
-49.51%
jan 1, 1991
-1.601 bln
-919.84 mln
135.04%
jan 1, 1992
-539.0 mln
+1.062 bln
-66.33%
jan 1, 1993
-1.344 bln
-805.0 mln
149.35%
jan 1, 1994
-1.702 bln
-357.965 mln
26.63%
jan 1, 1995
-2.342 bln
-640.404 mln
37.63%
jan 1, 1996
-4.302 bln
-1.959 bln
83.65%
jan 1, 1997
-2.846 bln
+1.455 bln
-33.83%
jan 1, 1998
-3.24 bln
-393.732 mln
13.83%
jan 1, 1999
-3.005 bln
+235.161 mln
-7.26%
jan 1, 2000
-1.343 bln
+1.662 bln
-55.32%
jan 1, 2001
-1.156 bln
+186.29 mln
-13.87%
jan 1, 2002
-1.11 bln
+46.683 mln
-4.04%
jan 1, 2003
-1.002 bln
+108.057 mln
-9.74%
jan 1, 2004
-231.728 mln
+769.909 mln
-76.87%
jan 1, 2005
156.972 mln
+388.7 mln
-167.74%
jan 1, 2006
1.447 bln
+1.29 bln
821.8%
jan 1, 2007
2.366 bln
+918.562 mln
63.48%
jan 1, 2008
1.255 bln
-1.111 bln
-46.96%
jan 1, 2009
-5.505 bln
-6.759 bln
-538.7%
jan 1, 2010
-1.361 bln
+4.144 bln
-75.28%
jan 1, 2011
-2.416 bln
-1.055 bln
77.54%
jan 1, 2012
-4.03 bln
-1.614 bln
66.81%
jan 1, 2013
-5.006 bln
-975.551 mln
24.21%
jan 1, 2014
-8.507 bln
-3.501 bln
69.94%
jan 1, 2015
-9.006 bln
-499.07 mln
5.87%
jan 1, 2016
-10.893 bln
-1.887 bln
20.96%
Ranking of countries by current statistics by years


Comments: