29
/
en
AIzaSyAYiBZKx7MnpbEhh9jyipgxe19OcubqV5w
April 1, 2024
105415
Chile
CHL
true
2
1
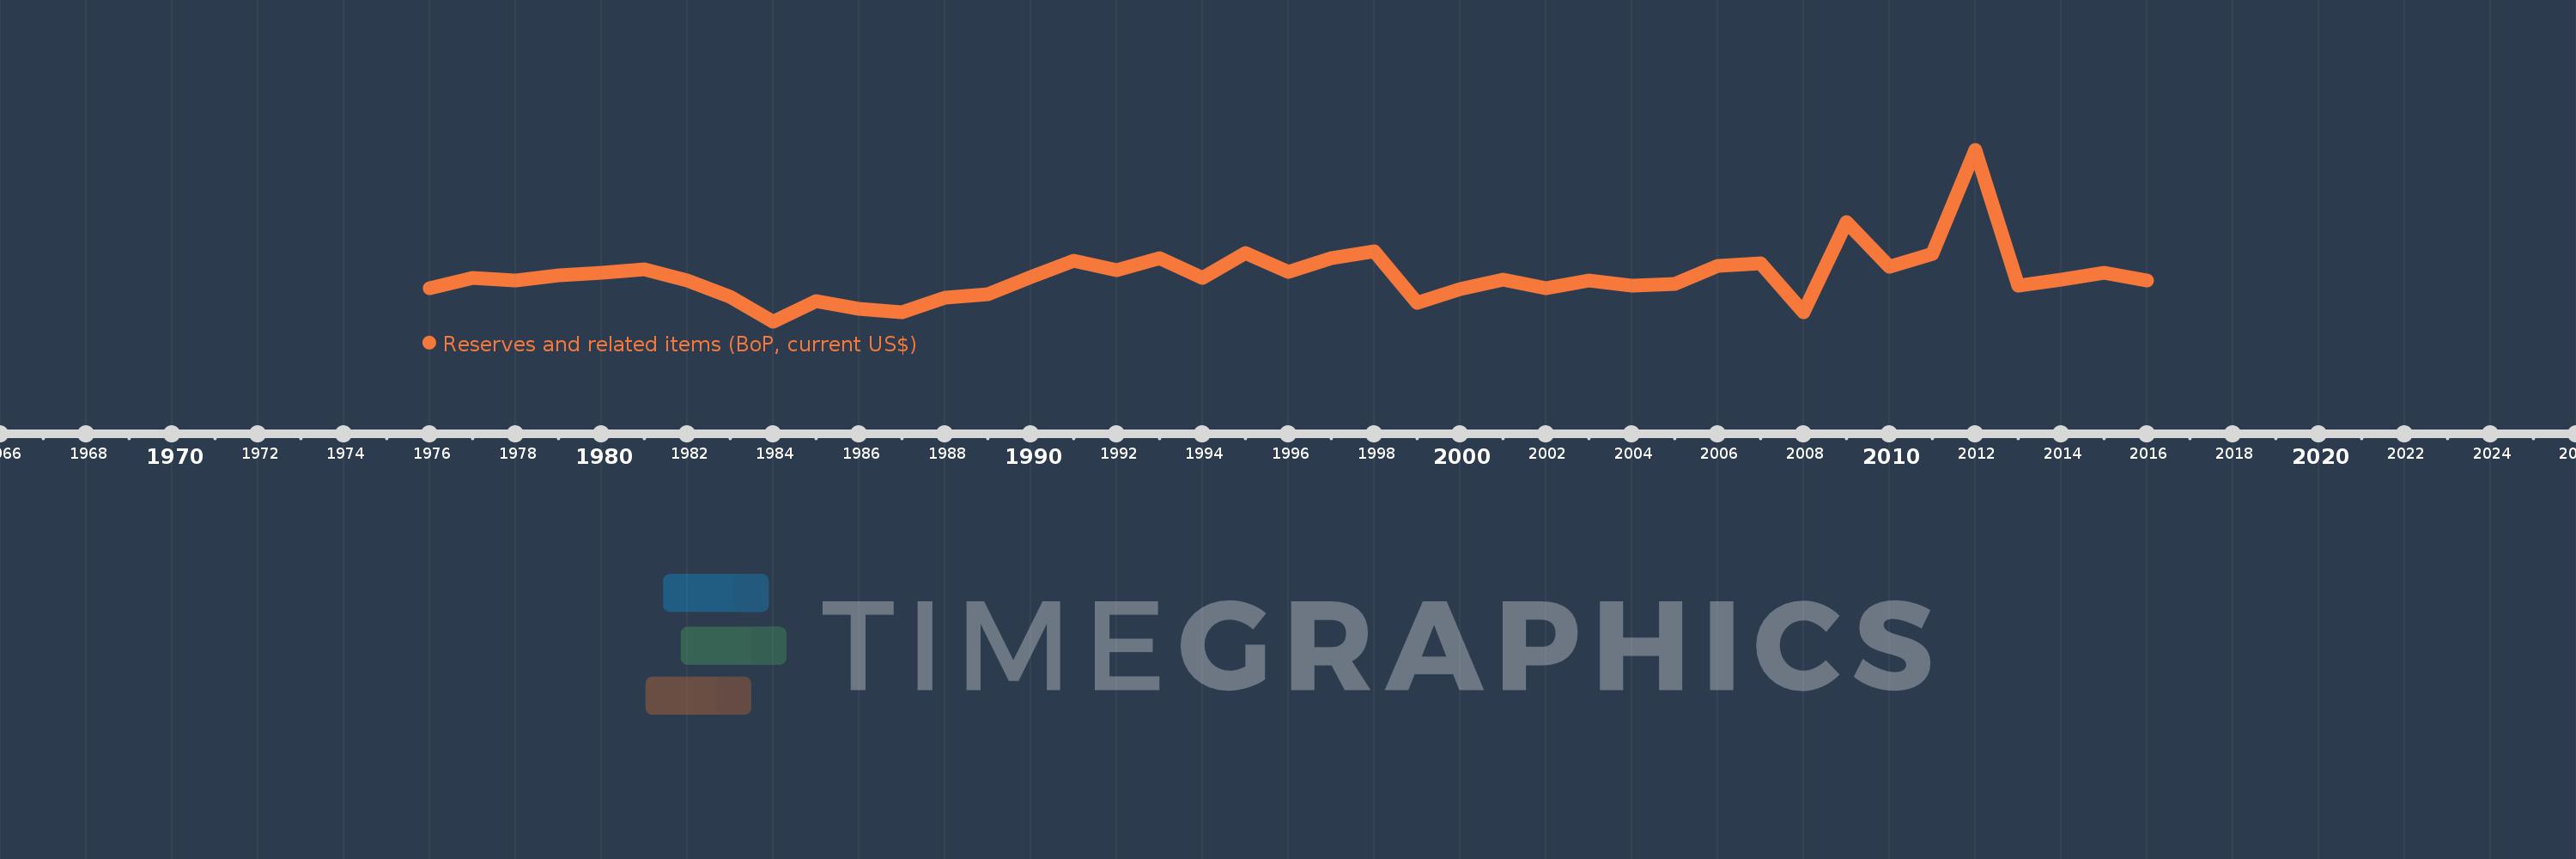
Reserves and related items (BoP, current US$)
2016,2015,2014,2013,2012,2011,2010,2009,2008,2007,2006,2005,2004,2003,2002,2001,2000,1999,1998,1997,1996,1995,1994,1993,1992,1991,1990,1989,1988,1987,1986,1985,1984,1983,1982,1981,1980,1979,1978,1977,1976
This statistics in other country:
AfghanistanAlbaniaAlgeriaAngolaAntigua and BarbudaArgentinaArmeniaArubaAustraliaAustriaAzerbaijanBahamas, TheBahrainBangladeshBarbadosBelarusBelgiumBelizeBeninBermudaBhutanBoliviaBosnia and HerzegovinaBotswanaBrazilBrunei DarussalamBulgariaBurkina FasoBurundiCabo VerdeCambodiaCameroonCanadaChileChinaColombiaComorosCongo, Dem. Rep.Congo, Rep.Costa RicaCote d'IvoireCroatiaCuracaoCyprusCzech RepublicDenmarkDjiboutiDominicaDominican RepublicEcuadorEgypt, Arab Rep.El SalvadorEstoniaEthiopiaEuro areaFijiFinlandFranceFrench PolynesiaGabonGambia, TheGeorgiaGermanyGhanaGreeceGrenadaGuatemalaGuineaGuinea-BissauGuyanaHaitiHondurasHong Kong SAR, ChinaHungaryIcelandIndiaIndonesiaIraqIrelandIsraelItalyJamaicaJapanJordanKazakhstanKenyaKiribatiKorea, Rep.KosovoKuwaitKyrgyz RepublicLao PDRLatviaLebanonLesothoLiberiaLibyaLithuaniaLuxembourgMacao SAR, ChinaMacedonia, FYRMadagascarMalawiMalaysiaMaldivesMaliMaltaMarshall IslandsMauritaniaMauritiusMexicoMicronesia, Fed. Sts.MoldovaMongoliaMontenegroMoroccoMozambiqueMyanmarNamibiaNepalNetherlandsNew CaledoniaNew ZealandNicaraguaNigerNigeriaNorwayOmanPakistanPalauPanamaPapua New GuineaParaguayPeruPhilippinesPolandPortugalQatarRomaniaRussian FederationRwandaSamoaSao Tome and PrincipeSaudi ArabiaSenegalSerbiaSeychellesSierra LeoneSingaporeSint Maarten (Dutch part)Slovak RepublicSloveniaSolomon IslandsSouth AfricaSouth SudanSpainSri LankaSt. Kitts and NevisSt. LuciaSt. Vincent and the GrenadinesSudanSurinameSwazilandSwedenSwitzerlandSyrian Arab RepublicTajikistanTanzaniaThailandTimor-LesteTogoTongaTrinidad and TobagoTunisiaTurkeyTuvaluUgandaUkraineUnited KingdomUnited StatesUruguayVanuatuVenezuela, RBVietnamWest Bank and GazaYemen, Rep.ZambiaZimbabwe Timeline:
This timeline shows a graph from 1976 to 2016 of Chile. No data until 1975. Number of actual observations by date: 41.
Source name:
World Development Indicators
Source organization:
International Monetary Fund, Balance of Payments Statistics Yearbook and data files.
Categories, topics:
Economy & Growth
Last updated:
apr 23, 2017
Indicators value changes by year
Minimum:
-4.273 bln
jan 1, 1984
Maximum:
14.192 bln
jan 1, 2012
At the date of observation
Value
Absolute change
Change from previous value
jan 1, 1976
-666.437 mln
-666.437 mln
0.0%
jan 1, 1977
464.388 mln
+1.131 bln
-169.68%
jan 1, 1978
164.305 mln
-300.084 mln
-64.62%
jan 1, 1979
743.596 mln
+579.292 mln
352.57%
jan 1, 1980
989.678 mln
+246.082 mln
33.09%
jan 1, 1981
1.351 bln
+361.311 mln
36.51%
jan 1, 1982
165.027 mln
-1.186 bln
-87.78%
jan 1, 1983
-1.539 bln
-1.704 bln
-1.03K%
jan 1, 1984
-4.273 bln
-2.734 bln
177.62%
jan 1, 1985
-2.001 bln
+2.272 bln
-53.16%
jan 1, 1986
-2.877 bln
-875.587 mln
43.75%
jan 1, 1987
-3.187 bln
-309.966 mln
10.77%
jan 1, 1988
-1.621 bln
+1.566 bln
-49.15%
jan 1, 1989
-1.256 bln
+364.477 mln
-22.49%
jan 1, 1990
518.982 mln
+1.775 bln
-141.32%
jan 1, 1991
2.323 bln
+1.804 bln
347.51%
jan 1, 1992
1.257 bln
-1.065 bln
-45.88%
jan 1, 1993
2.547 bln
+1.29 bln
102.59%
jan 1, 1994
427.525 mln
-2.119 bln
-83.21%
jan 1, 1995
3.151 bln
+2.723 bln
636.99%
jan 1, 1996
1.139 bln
-2.012 bln
-63.87%
jan 1, 1997
2.593 bln
+1.455 bln
127.78%
jan 1, 1998
3.318 bln
+725.092 mln
27.96%
jan 1, 1999
-2.191 bln
-5.51 bln
-166.03%
jan 1, 2000
-746.516 mln
+1.445 bln
-65.93%
jan 1, 2001
316.534 mln
+1.063 bln
-142.4%
jan 1, 2002
-598.959 mln
-915.493 mln
-289.22%
jan 1, 2003
185.024 mln
+783.983 mln
-130.89%
jan 1, 2004
-357.201 mln
-542.224 mln
-293.06%
jan 1, 2005
-191.455 mln
+165.746 mln
-46.4%
jan 1, 2006
1.711 bln
+1.902 bln
-993.58%
jan 1, 2007
1.998 bln
+287.523 mln
16.81%
jan 1, 2008
-3.214 bln
-5.212 bln
-260.82%
jan 1, 2009
6.461 bln
+9.675 bln
-301.05%
jan 1, 2010
1.648 bln
-4.813 bln
-74.5%
jan 1, 2011
3.023 bln
+1.375 bln
83.46%
jan 1, 2012
14.192 bln
+11.169 bln
369.45%
jan 1, 2013
-365.901 mln
-14.558 bln
-102.58%
jan 1, 2014
312.038 mln
+677.939 mln
-185.28%
jan 1, 2015
1.057 bln
+744.785 mln
238.68%
jan 1, 2016
225.898 mln
-830.925 mln
-78.62%
Ranking of countries by current statistics by years


Comments: