29
/
en
AIzaSyAYiBZKx7MnpbEhh9jyipgxe19OcubqV5w
April 1, 2024
30262
Euro area
EMU
false
2
1
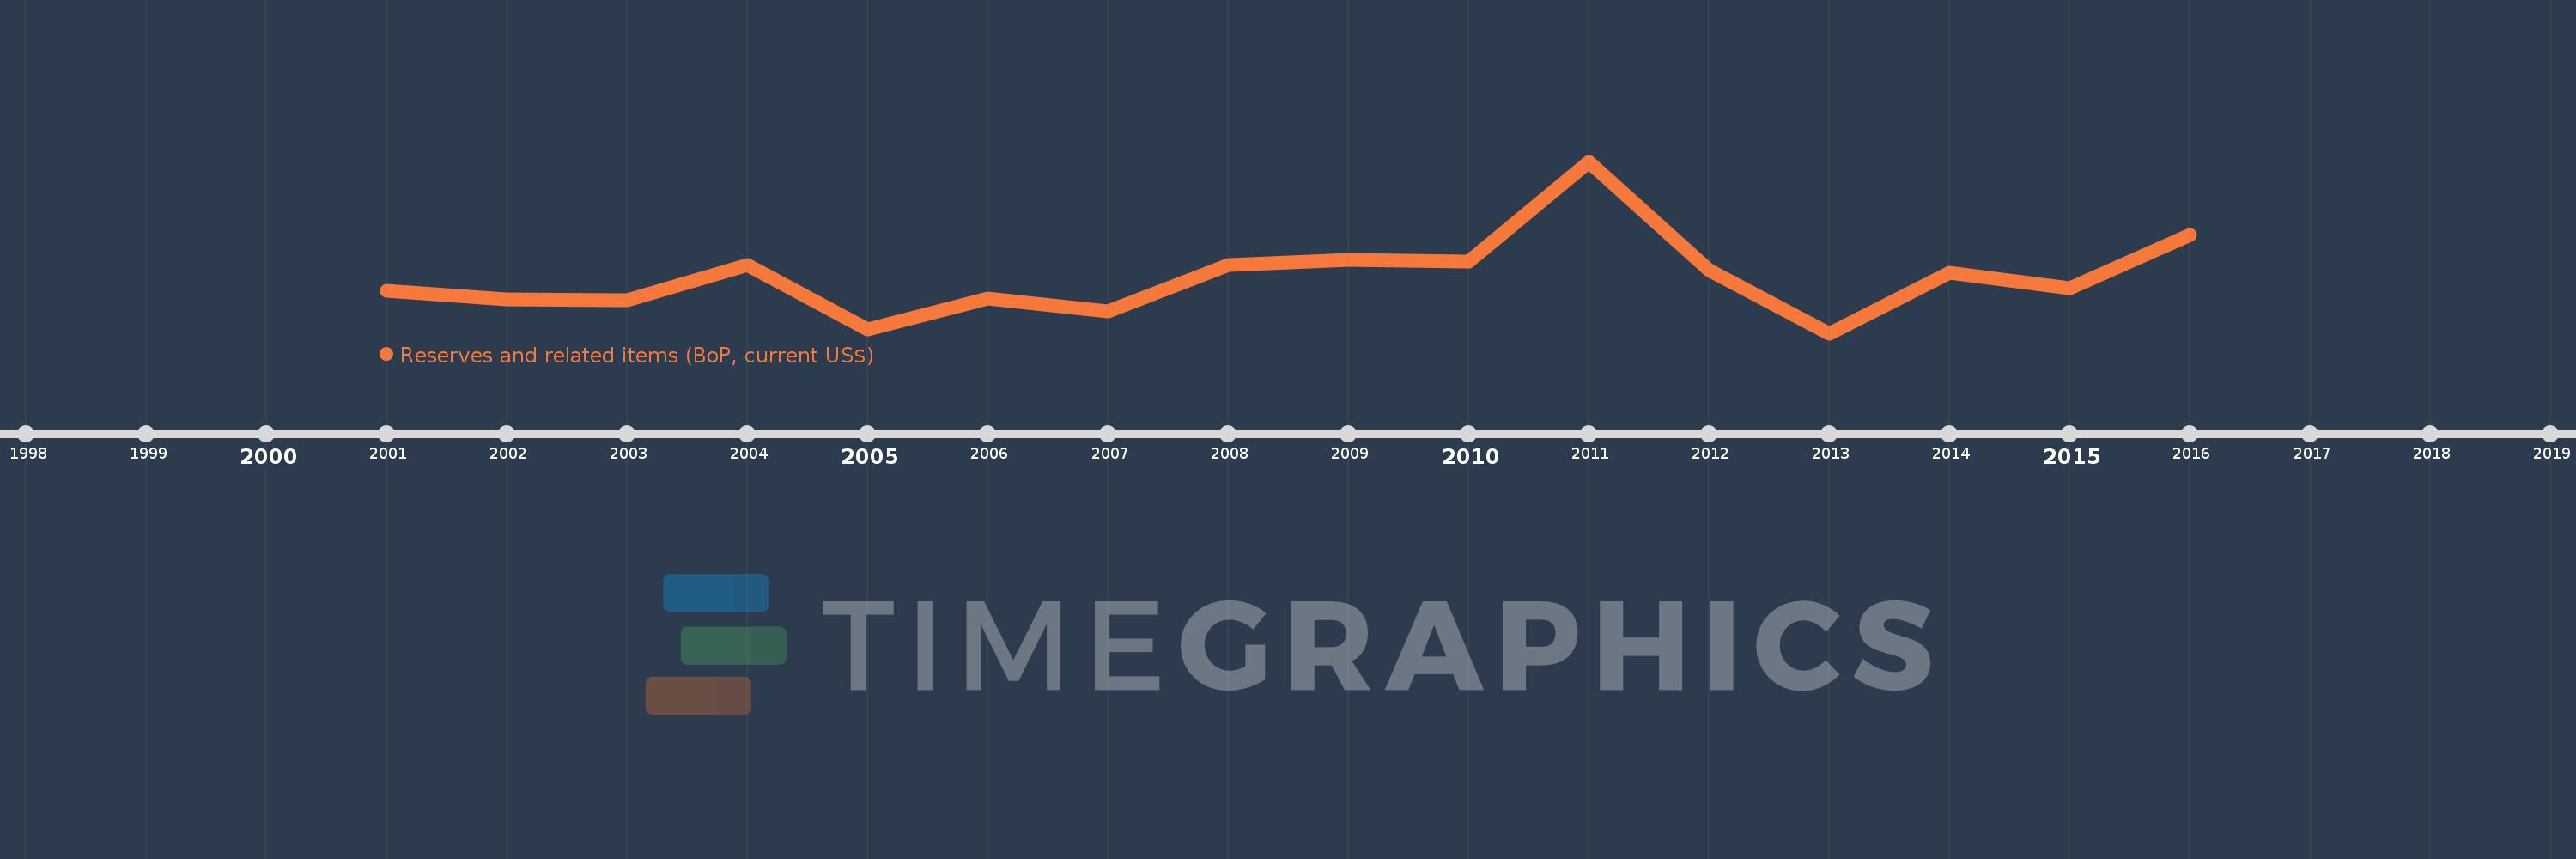
Reserves and related items (BoP, current US$)
2016,2015,2014,2013,2012,2011,2010,2009,2008,2007,2006,2005,2004,2003,2002,2001
This statistics in other country:
AfghanistanAlbaniaAlgeriaAngolaAntigua and BarbudaArgentinaArmeniaArubaAustraliaAustriaAzerbaijanBahamas, TheBahrainBangladeshBarbadosBelarusBelgiumBelizeBeninBermudaBhutanBoliviaBosnia and HerzegovinaBotswanaBrazilBrunei DarussalamBulgariaBurkina FasoBurundiCabo VerdeCambodiaCameroonCanadaChileChinaColombiaComorosCongo, Dem. Rep.Congo, Rep.Costa RicaCote d'IvoireCroatiaCuracaoCyprusCzech RepublicDenmarkDjiboutiDominicaDominican RepublicEcuadorEgypt, Arab Rep.El SalvadorEstoniaEthiopiaEuro areaFijiFinlandFranceFrench PolynesiaGabonGambia, TheGeorgiaGermanyGhanaGreeceGrenadaGuatemalaGuineaGuinea-BissauGuyanaHaitiHondurasHong Kong SAR, ChinaHungaryIcelandIndiaIndonesiaIraqIrelandIsraelItalyJamaicaJapanJordanKazakhstanKenyaKiribatiKorea, Rep.KosovoKuwaitKyrgyz RepublicLao PDRLatviaLebanonLesothoLiberiaLibyaLithuaniaLuxembourgMacao SAR, ChinaMacedonia, FYRMadagascarMalawiMalaysiaMaldivesMaliMaltaMarshall IslandsMauritaniaMauritiusMexicoMicronesia, Fed. Sts.MoldovaMongoliaMontenegroMoroccoMozambiqueMyanmarNamibiaNepalNetherlandsNew CaledoniaNew ZealandNicaraguaNigerNigeriaNorwayOmanPakistanPalauPanamaPapua New GuineaParaguayPeruPhilippinesPolandPortugalQatarRomaniaRussian FederationRwandaSamoaSao Tome and PrincipeSaudi ArabiaSenegalSerbiaSeychellesSierra LeoneSingaporeSint Maarten (Dutch part)Slovak RepublicSloveniaSolomon IslandsSouth AfricaSouth SudanSpainSri LankaSt. Kitts and NevisSt. LuciaSt. Vincent and the GrenadinesSudanSurinameSwazilandSwedenSwitzerlandSyrian Arab RepublicTajikistanTanzaniaThailandTimor-LesteTogoTongaTrinidad and TobagoTunisiaTurkeyTuvaluUgandaUkraineUnited KingdomUnited StatesUruguayVanuatuVenezuela, RBVietnamWest Bank and GazaYemen, Rep.ZambiaZimbabwe Timeline:
This timeline shows a graph from 2001 to 2016 of Euro area. No data until 2000. Number of actual observations by date: 16.
Source name:
World Development Indicators
Source organization:
International Monetary Fund, Balance of Payments Statistics Yearbook and data files.
Categories, topics:
Economy & Growth
Last updated:
apr 23, 2017
Indicators value changes by year
Minimum:
-34.833 bln
jan 1, 2013
Maximum:
59.743 bln
jan 1, 2011
At the date of observation
Value
Absolute change
Change from previous value
jan 1, 2001
-11.576 bln
-11.576 bln
0.0%
jan 1, 2002
-16.152 bln
-4.577 bln
39.54%
jan 1, 2003
-16.449 bln
-296.405 mln
1.84%
jan 1, 2004
2.975 bln
+19.424 bln
-118.09%
jan 1, 2005
-32.802 bln
-35.777 bln
-1.2K%
jan 1, 2006
-15.559 bln
+17.242 bln
-52.57%
jan 1, 2007
-22.911 bln
-7.351 bln
47.25%
jan 1, 2008
2.567 bln
+25.478 bln
-111.2%
jan 1, 2009
5.692 bln
+3.126 bln
121.78%
jan 1, 2010
4.86 bln
-832.081 mln
-14.62%
jan 1, 2011
59.743 bln
+54.883 bln
1.13K%
jan 1, 2012
122.178 mln
-59.621 bln
-99.8%
jan 1, 2013
-34.833 bln
-34.955 bln
-28.61K%
jan 1, 2014
-1.288 bln
+33.545 bln
-96.3%
jan 1, 2015
-10.076 bln
-8.789 bln
682.52%
jan 1, 2016
19.208 bln
+29.284 bln
-290.62%
Ranking of countries by current statistics by years


Comments: