29
/pt/
pt
AIzaSyAYiBZKx7MnpbEhh9jyipgxe19OcubqV5w
April 1, 2024
99521
Cameroon
CMR
true
2
1
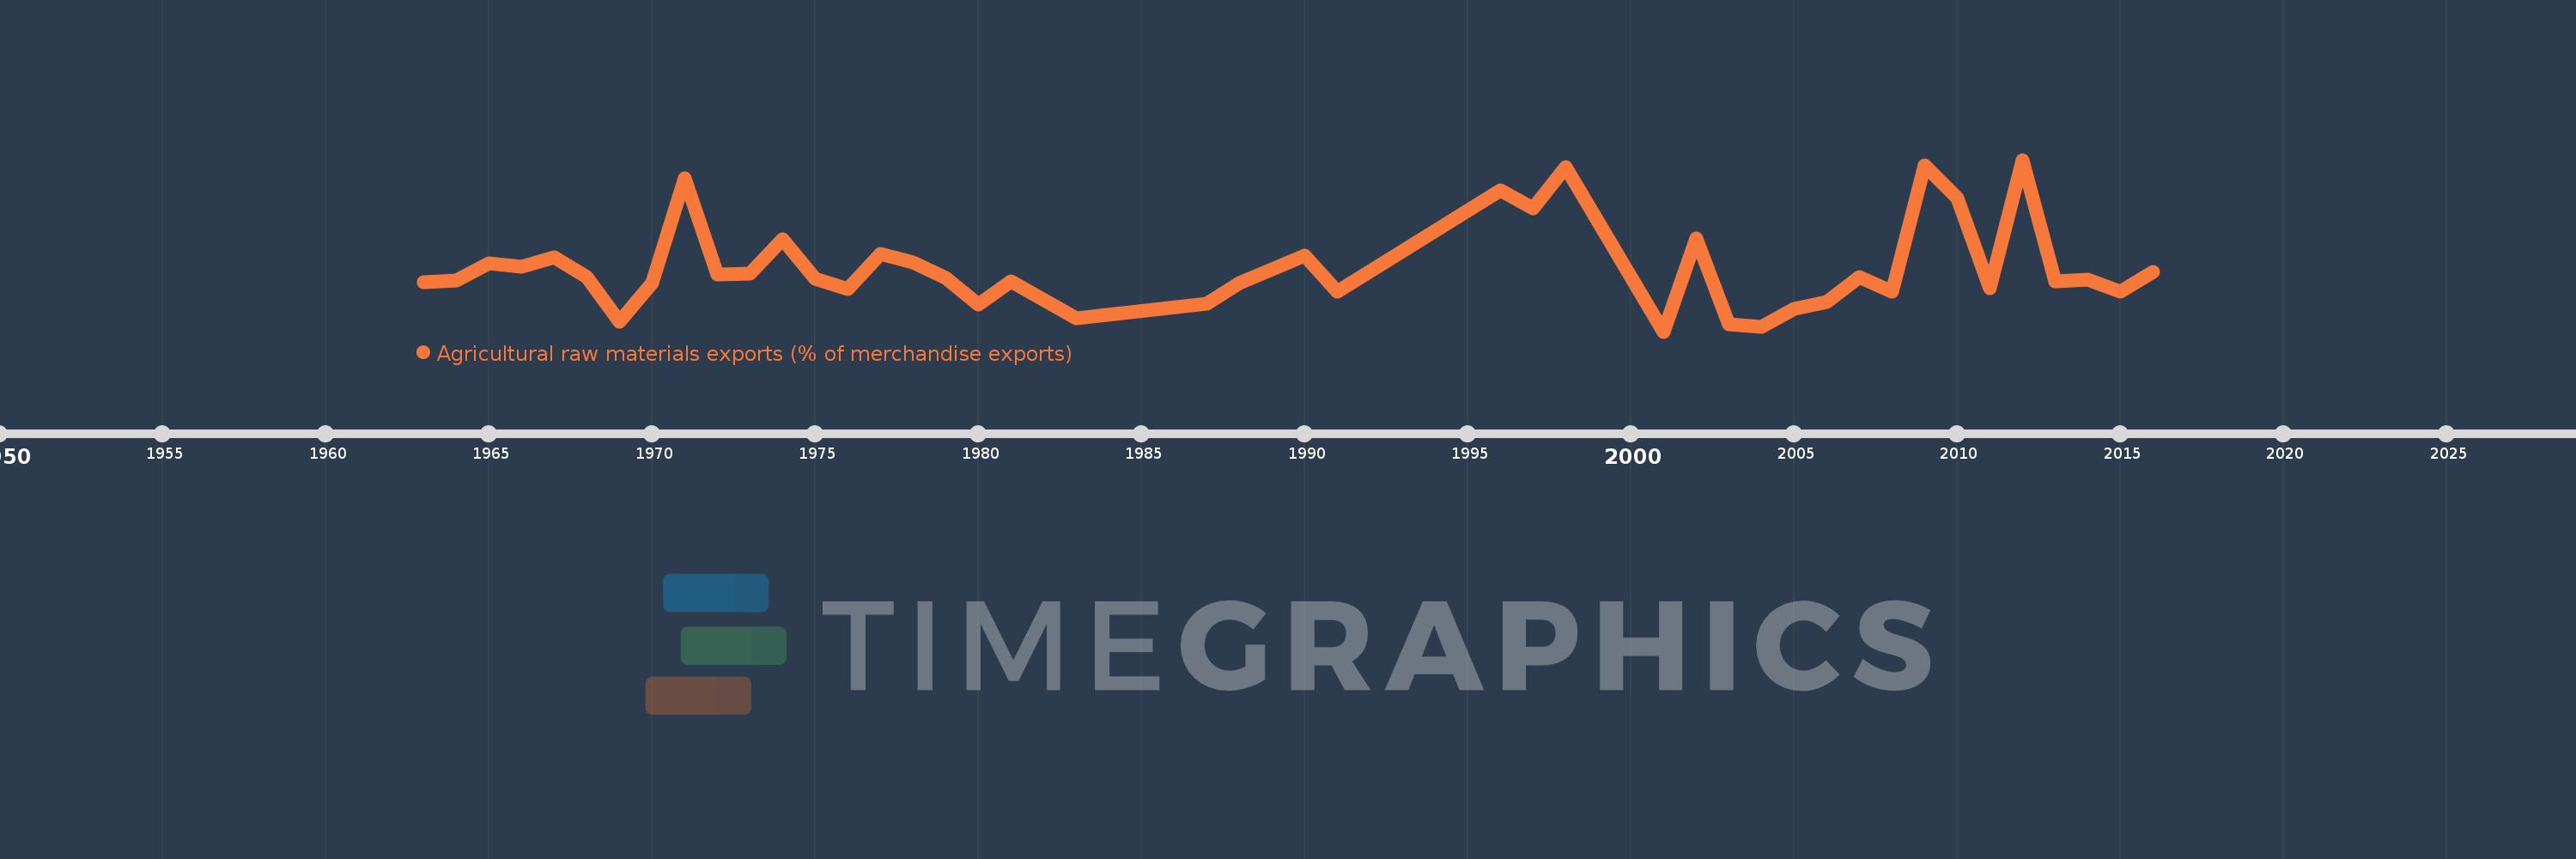
Agricultural raw materials exports (% of merchandise exports)
2016,2015,2014,2013,2012,2011,2010,2009,2008,2007,2006,2005,2004,2003,2002,2001,1998,1997,1996,1991,1990,1988,1987,1983,1981,1980,1979,1978,1977,1976,1975,1974,1973,1972,1971,1970,1969,1968,1967,1966,1965,1964,1963
Estas estatísticas em outros países:
AfghanistanAlbaniaAlgeriaAndorraAngolaAntigua and BarbudaArab WorldArgentinaArmeniaArubaAustraliaAustriaAzerbaijanBahamas, TheBahrainBangladeshBarbadosBelarusBelgiumBelizeBeninBermudaBhutanBoliviaBosnia and HerzegovinaBotswanaBrazilBrunei DarussalamBulgariaBurkina FasoBurundiCabo VerdeCambodiaCameroonCanadaCaribbean small statesCayman IslandsCentral African RepublicCentral Europe and the BalticsChadChileChinaColombiaComorosCongo, Dem. Rep.Congo, Rep.Costa RicaCote d'IvoireCroatiaCubaCyprusCzech RepublicDenmarkDjiboutiDominicaDominican RepublicEarly-demographic dividendEast Asia & PacificEast Asia & Pacific (excluding high income)East Asia & Pacific (IDA & IBRD countries)EcuadorEgypt, Arab Rep.El SalvadorEquatorial GuineaEritreaEstoniaEthiopiaEuro areaEurope & Central AsiaEurope & Central Asia (excluding high income)Europe & Central Asia (IDA & IBRD countries)European UnionFaroe IslandsFijiFinlandFragile and conflict affected situationsFranceFrench PolynesiaGabonGambia, TheGeorgiaGermanyGhanaGreeceGreenlandGrenadaGuatemalaGuineaGuinea-BissauGuyanaHaitiHeavily indebted poor countries (HIPC)High incomeHondurasHong Kong SAR, ChinaHungaryIBRD onlyIcelandIDA & IBRD totalIDA blendIDA onlyIDA totalIndiaIndonesiaIran, Islamic Rep.IraqIrelandIsraelItalyJamaicaJapanJordanKazakhstanKenyaKiribatiKorea, Rep.KuwaitKyrgyz RepublicLao PDRLate-demographic dividendLatin America & Caribbean Latin America & Caribbean (excluding high income)Latin America & the Caribbean (IDA & IBRD countries)LatviaLeast developed countries: UN classificationLebanonLesothoLiberiaLibyaLithuaniaLow & middle incomeLower middle incomeLuxembourgMacao SAR, ChinaMacedonia, FYRMadagascarMalawiMalaysiaMaldivesMaliMaltaMauritaniaMauritiusMexicoMiddle East & North AfricaMiddle East & North Africa (excluding high income)Middle East & North Africa (IDA & IBRD countries)Middle incomeMoldovaMongoliaMoroccoMozambiqueMyanmarNamibiaNepalNetherlandsNew CaledoniaNew ZealandNicaraguaNigerNigeriaNorth AmericaNorwayOECD membersOmanOther small statesPacific island small statesPakistanPalauPanamaPapua New GuineaParaguayPeruPhilippinesPolandPortugalPost-demographic dividendPre-demographic dividendQatarRomaniaRussian FederationRwandaSamoaSao Tome and PrincipeSaudi ArabiaSenegalSerbiaSeychellesSierra LeoneSingaporeSlovak RepublicSloveniaSmall statesSolomon IslandsSomaliaSouth AfricaSouth AsiaSouth Asia (IDA & IBRD)SpainSri LankaSt. Kitts and NevisSt. LuciaSt. Vincent and the GrenadinesSub-Saharan Africa Sub-Saharan Africa (excluding high income)Sub-Saharan Africa (IDA & IBRD countries)SudanSurinameSwazilandSwedenSwitzerlandSyrian Arab RepublicTajikistanTanzaniaThailandTimor-LesteTogoTongaTrinidad and TobagoTunisiaTurkeyTurkmenistanTurks and Caicos IslandsTuvaluUgandaUkraineUnited Arab EmiratesUnited KingdomUnited StatesUpper middle incomeUruguayVanuatuVenezuela, RBVietnamVirgin Islands (U.S.)WorldYemen, Rep.ZambiaZimbabwe Linha do tempo:
Nesta escala de tempo está apresentado um gráfico de 1963 ano até 2016 ano Cameroon. Dados de 1962 ano ausente. O número de observações reais por data: 43.
Fonte (nome):
Indicadores de desenvolvimento mundial
Fonte (organização):
World Bank staff estimates from the Comtrade database maintained by the United Nations Statistics Division.
Categorias:
Agriculture & Rural Development, Private Sector, Trade
Foi atualizado:
23 abr 2017 ano
Indicadores de alterações dos valores ao longo dos anos
Máximo:
31.556
1 jan 2012 ano
Na data de observação
Valor
Mudança absoluta
A alteração em relação ao valor anterior
1 jan 1963 ano
15.524
+15.524
0.0%
1 jan 1964 ano
15.821
+0.297
1.91%
1 jan 1965 ano
18.058
+2.237
14.14%
1 jan 1966 ano
17.574
-0.484
-2.68%
1 jan 1967 ano
18.776
+1.203
6.84%
1 jan 1968 ano
16.241
-2.535
-13.5%
1 jan 1969 ano
10.345
-5.897
-36.31%
1 jan 1970 ano
15.398
+5.053
48.84%
1 jan 1971 ano
29.162
+13.764
89.39%
1 jan 1972 ano
16.546
-12.615
-43.26%
1 jan 1973 ano
16.69
+0.143
0.87%
1 jan 1974 ano
21.137
+4.448
26.65%
1 jan 1975 ano
15.982
-5.155
-24.39%
1 jan 1976 ano
14.678
-1.304
-8.16%
1 jan 1977 ano
19.291
+4.613
31.43%
1 jan 1978 ano
18.183
-1.108
-5.75%
1 jan 1979 ano
16.068
-2.114
-11.63%
1 jan 1980 ano
12.627
-3.441
-21.42%
1 jan 1981 ano
15.699
+3.072
24.33%
1 jan 1983 ano
10.846
-4.853
-30.91%
1 jan 1987 ano
12.711
+1.866
17.2%
1 jan 1988 ano
15.496
+2.784
21.9%
1 jan 1990 ano
18.999
+3.503
22.61%
1 jan 1991 ano
14.288
-4.711
-24.8%
1 jan 1996 ano
27.515
+13.227
92.58%
1 jan 1997 ano
25.189
-2.326
-8.45%
1 jan 1998 ano
30.551
+5.362
21.29%
1 jan 2001 ano
9.1
-21.451
-70.21%
1 jan 2002 ano
21.25
+12.15
133.52%
1 jan 2003 ano
10.02
-11.231
-52.85%
1 jan 2004 ano
9.681
-0.339
-3.38%
1 jan 2005 ano
12.038
+2.357
24.35%
1 jan 2006 ano
12.999
+0.961
7.98%
1 jan 2007 ano
16.262
+3.263
25.1%
1 jan 2008 ano
14.272
-1.99
-12.24%
1 jan 2009 ano
30.799
+16.527
115.8%
1 jan 2010 ano
26.565
-4.233
-13.75%
1 jan 2011 ano
14.795
-11.77
-44.31%
1 jan 2012 ano
31.556
+16.76
113.28%
1 jan 2013 ano
15.676
-15.879
-50.32%
1 jan 2014 ano
15.923
+0.247
1.57%
1 jan 2015 ano
14.311
-1.612
-10.12%
1 jan 2016 ano
16.864
+2.553
17.84%
Classificação de países por estatísticas atuais por anos


Comentários: