29
/pt/
pt
AIzaSyAYiBZKx7MnpbEhh9jyipgxe19OcubqV5w
April 1, 2024
141531
Greece
GRC
true
2
1
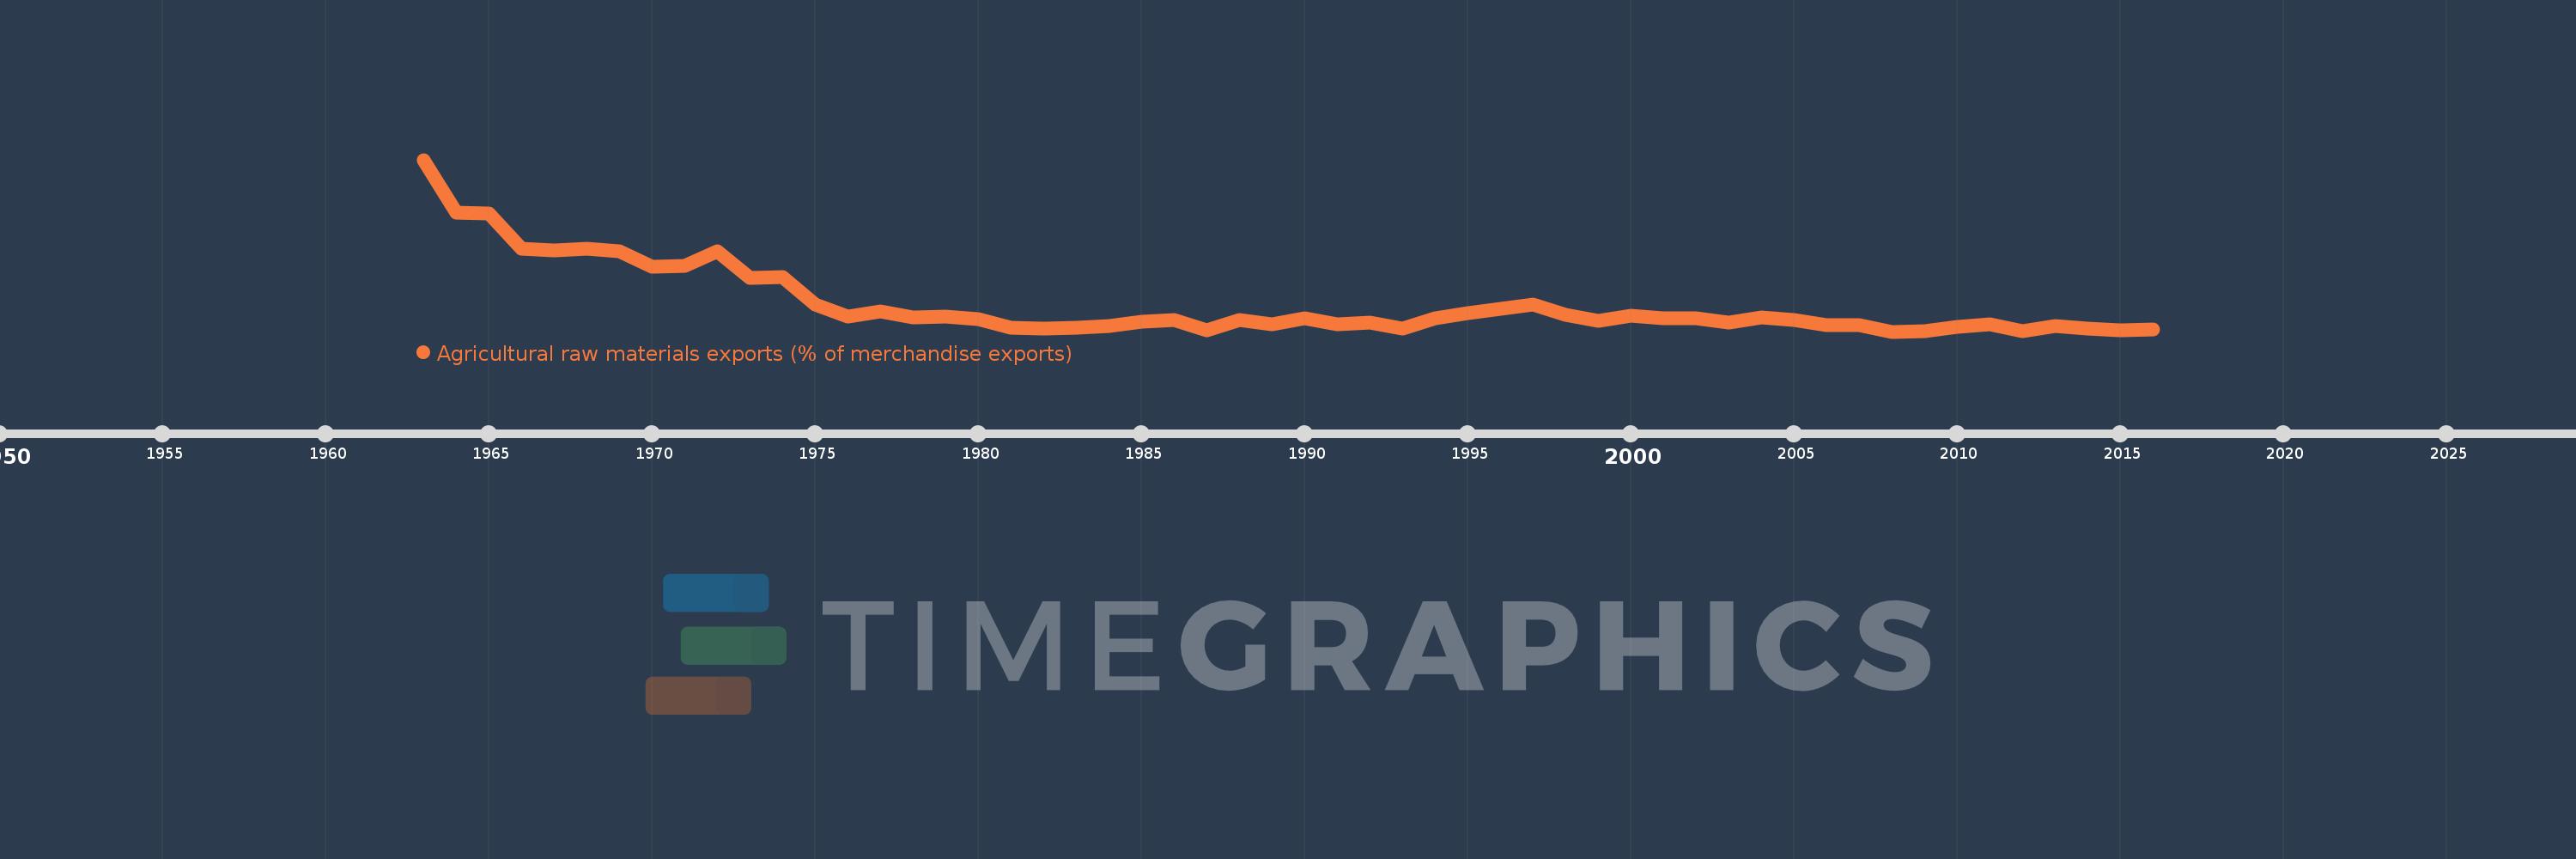
Agricultural raw materials exports (% of merchandise exports)
2016,2015,2014,2013,2012,2011,2010,2009,2008,2007,2006,2005,2004,2003,2002,2001,2000,1999,1998,1997,1996,1995,1994,1993,1992,1991,1990,1989,1988,1987,1986,1985,1984,1983,1982,1981,1980,1979,1978,1977,1976,1975,1974,1973,1972,1971,1970,1969,1968,1967,1966,1965,1964,1963
Estas estatísticas em outros países:
AfghanistanAlbaniaAlgeriaAndorraAngolaAntigua and BarbudaArab WorldArgentinaArmeniaArubaAustraliaAustriaAzerbaijanBahamas, TheBahrainBangladeshBarbadosBelarusBelgiumBelizeBeninBermudaBhutanBoliviaBosnia and HerzegovinaBotswanaBrazilBrunei DarussalamBulgariaBurkina FasoBurundiCabo VerdeCambodiaCameroonCanadaCaribbean small statesCayman IslandsCentral African RepublicCentral Europe and the BalticsChadChileChinaColombiaComorosCongo, Dem. Rep.Congo, Rep.Costa RicaCote d'IvoireCroatiaCubaCyprusCzech RepublicDenmarkDjiboutiDominicaDominican RepublicEarly-demographic dividendEast Asia & PacificEast Asia & Pacific (excluding high income)East Asia & Pacific (IDA & IBRD countries)EcuadorEgypt, Arab Rep.El SalvadorEquatorial GuineaEritreaEstoniaEthiopiaEuro areaEurope & Central AsiaEurope & Central Asia (excluding high income)Europe & Central Asia (IDA & IBRD countries)European UnionFaroe IslandsFijiFinlandFragile and conflict affected situationsFranceFrench PolynesiaGabonGambia, TheGeorgiaGermanyGhanaGreeceGreenlandGrenadaGuatemalaGuineaGuinea-BissauGuyanaHaitiHeavily indebted poor countries (HIPC)High incomeHondurasHong Kong SAR, ChinaHungaryIBRD onlyIcelandIDA & IBRD totalIDA blendIDA onlyIDA totalIndiaIndonesiaIran, Islamic Rep.IraqIrelandIsraelItalyJamaicaJapanJordanKazakhstanKenyaKiribatiKorea, Rep.KuwaitKyrgyz RepublicLao PDRLate-demographic dividendLatin America & Caribbean Latin America & Caribbean (excluding high income)Latin America & the Caribbean (IDA & IBRD countries)LatviaLeast developed countries: UN classificationLebanonLesothoLiberiaLibyaLithuaniaLow & middle incomeLower middle incomeLuxembourgMacao SAR, ChinaMacedonia, FYRMadagascarMalawiMalaysiaMaldivesMaliMaltaMauritaniaMauritiusMexicoMiddle East & North AfricaMiddle East & North Africa (excluding high income)Middle East & North Africa (IDA & IBRD countries)Middle incomeMoldovaMongoliaMoroccoMozambiqueMyanmarNamibiaNepalNetherlandsNew CaledoniaNew ZealandNicaraguaNigerNigeriaNorth AmericaNorwayOECD membersOmanOther small statesPacific island small statesPakistanPalauPanamaPapua New GuineaParaguayPeruPhilippinesPolandPortugalPost-demographic dividendPre-demographic dividendQatarRomaniaRussian FederationRwandaSamoaSao Tome and PrincipeSaudi ArabiaSenegalSerbiaSeychellesSierra LeoneSingaporeSlovak RepublicSloveniaSmall statesSolomon IslandsSomaliaSouth AfricaSouth AsiaSouth Asia (IDA & IBRD)SpainSri LankaSt. Kitts and NevisSt. LuciaSt. Vincent and the GrenadinesSub-Saharan Africa Sub-Saharan Africa (excluding high income)Sub-Saharan Africa (IDA & IBRD countries)SudanSurinameSwazilandSwedenSwitzerlandSyrian Arab RepublicTajikistanTanzaniaThailandTimor-LesteTogoTongaTrinidad and TobagoTunisiaTurkeyTurkmenistanTurks and Caicos IslandsTuvaluUgandaUkraineUnited Arab EmiratesUnited KingdomUnited StatesUpper middle incomeUruguayVanuatuVenezuela, RBVietnamVirgin Islands (U.S.)WorldYemen, Rep.ZambiaZimbabwe Linha do tempo:
Nesta escala de tempo está apresentado um gráfico de 1963 ano até 2016 ano Greece. Dados de 1962 ano ausente. O número de observações reais por data: 54.
Fonte (nome):
Indicadores de desenvolvimento mundial
Fonte (organização):
World Bank staff estimates from the Comtrade database maintained by the United Nations Statistics Division.
Categorias:
Agriculture & Rural Development, Private Sector, Trade
Foi atualizado:
23 abr 2017 ano
Indicadores de alterações dos valores ao longo dos anos
Mínimo:
1.593
1 jan 2008 ano
Máximo:
23.072
1 jan 1963 ano
Na data de observação
Valor
Mudança absoluta
A alteração em relação ao valor anterior
1 jan 1963 ano
23.072
+23.072
0.0%
1 jan 1964 ano
16.425
-6.647
-28.81%
1 jan 1965 ano
16.315
-0.11
-0.67%
1 jan 1966 ano
11.969
-4.347
-26.64%
1 jan 1967 ano
11.768
-0.2
-1.67%
1 jan 1968 ano
11.996
+0.227
1.93%
1 jan 1969 ano
11.643
-0.352
-2.94%
1 jan 1970 ano
9.669
-1.974
-16.96%
1 jan 1971 ano
9.757
+0.088
0.91%
1 jan 1972 ano
11.669
+1.911
19.59%
1 jan 1973 ano
8.252
-3.417
-29.28%
1 jan 1974 ano
8.378
+0.127
1.54%
1 jan 1975 ano
5.003
-3.375
-40.29%
1 jan 1976 ano
3.504
-1.499
-29.96%
1 jan 1977 ano
4.088
+0.583
16.64%
1 jan 1978 ano
3.405
-0.683
-16.7%
1 jan 1979 ano
3.51
+0.105
3.08%
1 jan 1980 ano
3.144
-0.365
-10.41%
1 jan 1981 ano
2.117
-1.027
-32.68%
1 jan 1982 ano
1.926
-0.191
-9.01%
1 jan 1983 ano
2.098
+0.172
8.91%
1 jan 1984 ano
2.251
+0.153
7.3%
1 jan 1985 ano
2.84
+0.589
26.16%
1 jan 1986 ano
3.007
+0.166
5.86%
1 jan 1987 ano
1.767
-1.239
-41.21%
1 jan 1988 ano
3.02
+1.253
70.87%
1 jan 1989 ano
2.49
-0.53
-17.56%
1 jan 1990 ano
3.254
+0.764
30.69%
1 jan 1991 ano
2.556
-0.698
-21.45%
1 jan 1992 ano
2.695
+0.139
5.43%
1 jan 1993 ano
2.017
-0.678
-25.15%
1 jan 1994 ano
3.299
+1.282
63.54%
1 jan 1995 ano
3.915
+0.616
18.69%
1 jan 1996 ano
4.41
+0.495
12.64%
1 jan 1997 ano
4.982
+0.572
12.97%
1 jan 1998 ano
3.7
-1.282
-25.74%
1 jan 1999 ano
2.965
-0.735
-19.87%
1 jan 2000 ano
3.619
+0.654
22.08%
1 jan 2001 ano
3.308
-0.311
-8.59%
1 jan 2002 ano
3.243
-0.065
-1.97%
1 jan 2003 ano
2.669
-0.574
-17.7%
1 jan 2004 ano
3.352
+0.683
25.6%
1 jan 2005 ano
3.042
-0.31
-9.25%
1 jan 2006 ano
2.417
-0.625
-20.55%
1 jan 2007 ano
2.404
-0.013
-0.55%
1 jan 2008 ano
1.593
-0.811
-33.73%
1 jan 2009 ano
1.598
+0.006
0.35%
1 jan 2010 ano
2.204
+0.606
37.92%
1 jan 2011 ano
2.465
+0.261
11.82%
1 jan 2012 ano
1.688
-0.777
-31.52%
1 jan 2013 ano
2.254
+0.566
33.55%
1 jan 2014 ano
2.017
-0.237
-10.52%
1 jan 2015 ano
1.731
-0.286
-14.19%
1 jan 2016 ano
1.827
+0.096
5.53%
Classificação de países por estatísticas atuais por anos


Comentários: