29
/pt/
pt
AIzaSyAYiBZKx7MnpbEhh9jyipgxe19OcubqV5w
April 1, 2024
94919
Burkina Faso
BFA
true
2
1
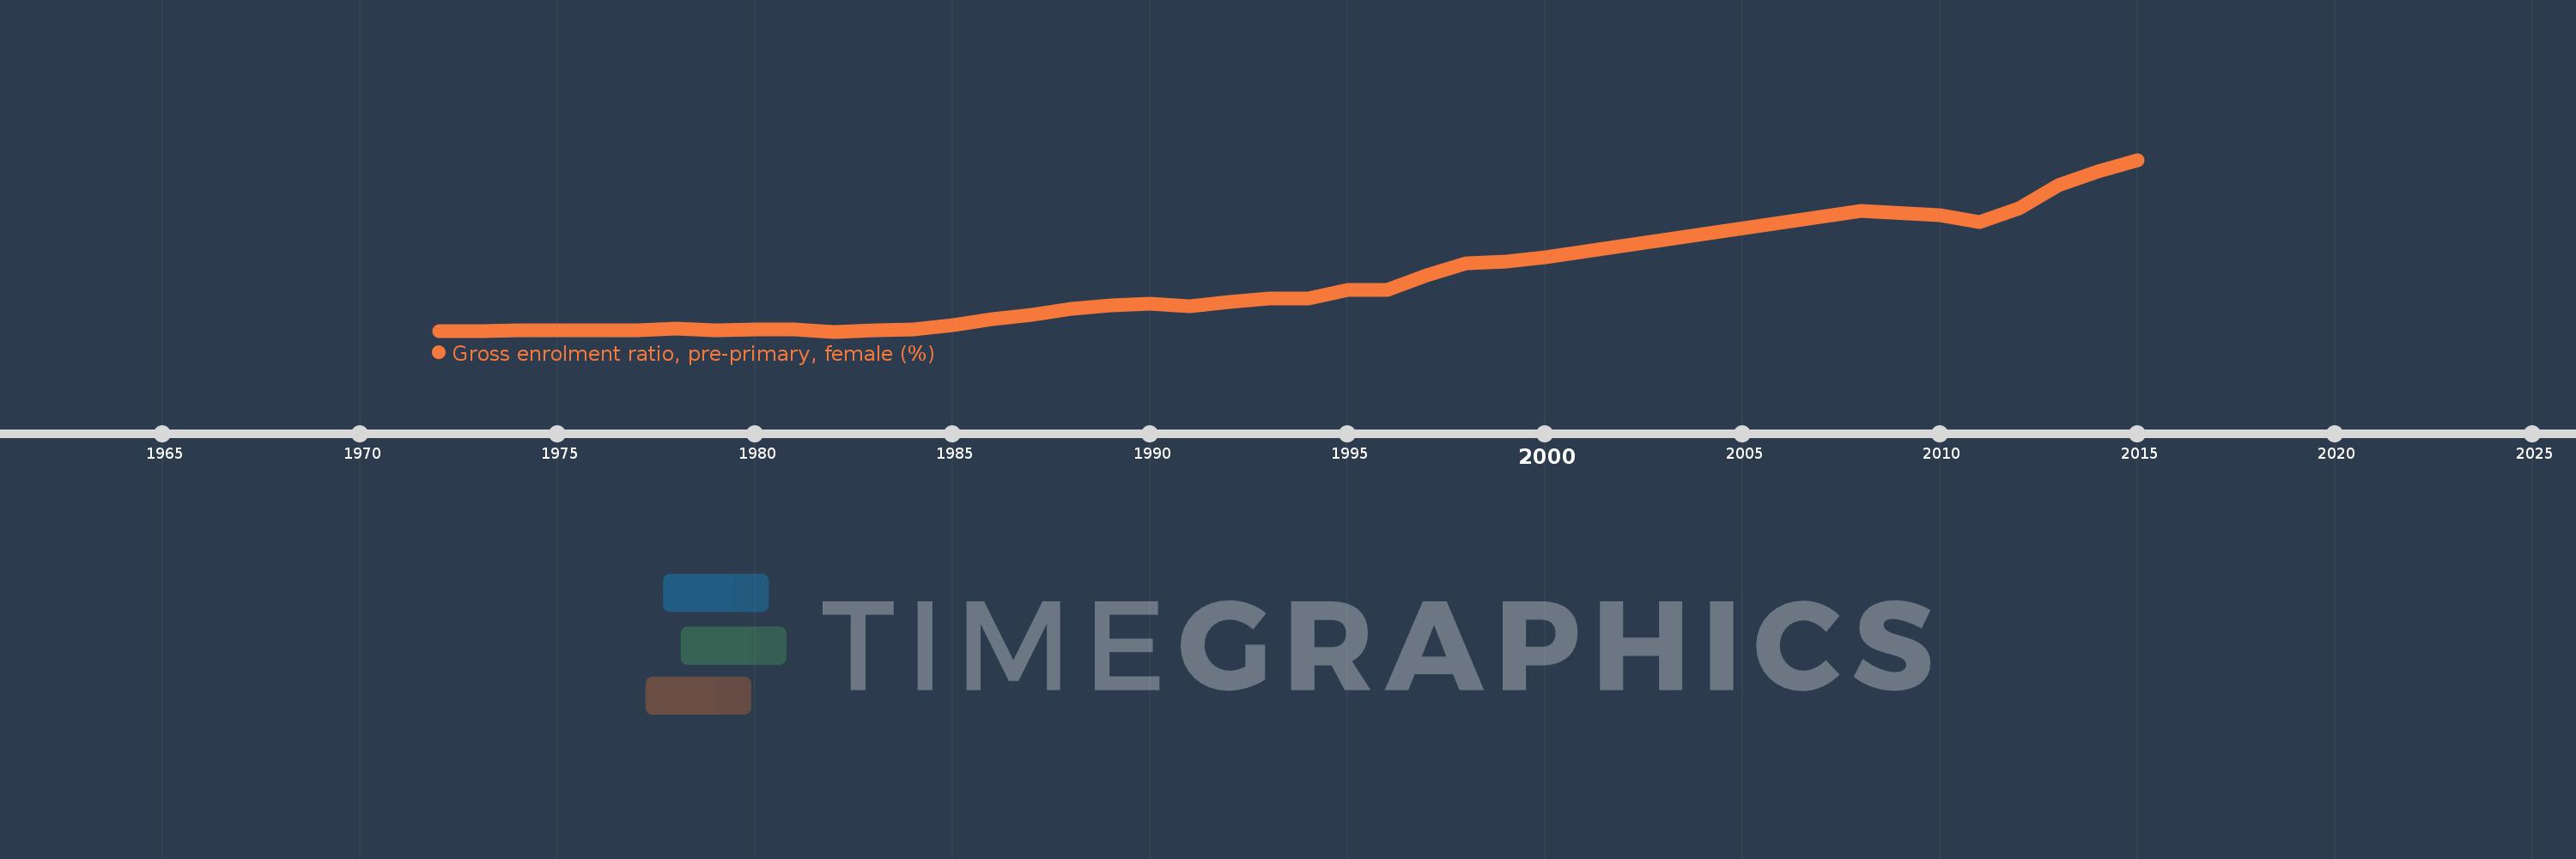
Gross enrolment ratio, pre-primary, female (%)
2015,2014,2013,2012,2011,2010,2008,2000,1999,1998,1997,1996,1995,1994,1993,1992,1991,1990,1989,1988,1987,1986,1985,1984,1983,1982,1981,1980,1979,1978,1977,1976,1975,1974,1973,1972
Estas estatísticas em outros países:
AfghanistanAlbaniaAlgeriaAndorraAngolaAntigua and BarbudaArab WorldArgentinaArmeniaArubaAustraliaAustriaAzerbaijanBahamas, TheBahrainBangladeshBarbadosBelarusBelgiumBelizeBeninBermudaBhutanBoliviaBosnia and HerzegovinaBotswanaBrazilBrunei DarussalamBulgariaBurkina FasoBurundiCabo VerdeCambodiaCameroonCanadaCaribbean small statesCentral African RepublicCentral Europe and the BalticsChadChileChinaColombiaComorosCongo, Dem. Rep.Congo, Rep.Costa RicaCote d'IvoireCroatiaCubaCyprusCzech RepublicDenmarkDjiboutiDominicaDominican RepublicEarly-demographic dividendEast Asia & PacificEast Asia & Pacific (excluding high income)East Asia & Pacific (IDA & IBRD countries)EcuadorEgypt, Arab Rep.El SalvadorEquatorial GuineaEritreaEstoniaEthiopiaEuro areaEurope & Central AsiaEurope & Central Asia (excluding high income)Europe & Central Asia (IDA & IBRD countries)European UnionFijiFinlandFragile and conflict affected situationsFranceGabonGambia, TheGeorgiaGermanyGhanaGreeceGrenadaGuatemalaGuineaGuinea-BissauGuyanaHeavily indebted poor countries (HIPC)High incomeHondurasHong Kong SAR, ChinaHungaryIBRD onlyIcelandIDA & IBRD totalIDA blendIDA onlyIDA totalIndiaIndonesiaIran, Islamic Rep.IraqIrelandIsraelItalyJamaicaJapanJordanKazakhstanKenyaKorea, Dem. People’s Rep.Korea, Rep.KuwaitKyrgyz RepublicLao PDRLate-demographic dividendLatin America & Caribbean Latin America & Caribbean (excluding high income)Latin America & the Caribbean (IDA & IBRD countries)LatviaLeast developed countries: UN classificationLebanonLesothoLiberiaLibyaLiechtensteinLithuaniaLow & middle incomeLow incomeLower middle incomeLuxembourgMacao SAR, ChinaMacedonia, FYRMadagascarMaldivesMaliMaltaMarshall IslandsMauritaniaMauritiusMexicoMicronesia, Fed. Sts.Middle East & North AfricaMiddle East & North Africa (excluding high income)Middle East & North Africa (IDA & IBRD countries)Middle incomeMoldovaMongoliaMontenegroMoroccoMozambiqueMyanmarNamibiaNauruNepalNetherlandsNew ZealandNicaraguaNigerNigeriaNorth AmericaNorwayOECD membersOmanOther small statesPacific island small statesPakistanPalauPanamaPapua New GuineaParaguayPeruPhilippinesPolandPortugalPost-demographic dividendPre-demographic dividendPuerto RicoQatarRomaniaRussian FederationRwandaSamoaSan MarinoSao Tome and PrincipeSaudi ArabiaSenegalSerbiaSeychellesSierra LeoneSlovak RepublicSloveniaSmall statesSolomon IslandsSomaliaSouth AfricaSouth AsiaSouth Asia (IDA & IBRD)South SudanSpainSri LankaSt. Kitts and NevisSt. LuciaSt. Vincent and the GrenadinesSub-Saharan Africa Sub-Saharan Africa (excluding high income)Sub-Saharan Africa (IDA & IBRD countries)SudanSurinameSwazilandSwedenSwitzerlandSyrian Arab RepublicTajikistanTanzaniaThailandTimor-LesteTogoTongaTrinidad and TobagoTunisiaTurkeyTurkmenistanTuvaluUgandaUkraineUnited Arab EmiratesUnited KingdomUnited StatesUpper middle incomeUruguayUzbekistanVanuatuVenezuela, RBVietnamWest Bank and GazaWorldYemen, Rep.Zimbabwe Linha do tempo:
Nesta escala de tempo está apresentado um gráfico de 1972 ano até 2015 ano Burkina Faso. Dados de 1971 ano ausente. O número de observações reais por data: 36.
Fonte (nome):
Indicadores de desenvolvimento mundial
Fonte (organização):
UNESCO Institute for Statistics
Categorias:
Education, Gender
Foi atualizado:
23 abr 2017 ano
Indicadores de alterações dos valores ao longo dos anos
Mínimo:
0.057
1 jan 1982 ano
Máximo:
4.252
1 jan 2015 ano
Na data de observação
Valor
Mudança absoluta
A alteração em relação ao valor anterior
1 jan 1972 ano
0.068
+0.068
0.0%
1 jan 1973 ano
0.071
+0.002
3.3%
1 jan 1974 ano
0.098
+0.028
39.68%
1 jan 1975 ano
0.086
-0.013
-12.78%
1 jan 1976 ano
0.082
-0.004
-4.2%
1 jan 1977 ano
0.085
+0.003
3.88%
1 jan 1978 ano
0.124
+0.038
44.71%
1 jan 1979 ano
0.087
-0.037
-29.93%
1 jan 1980 ano
0.118
+0.032
36.57%
1 jan 1981 ano
0.117
-0.001
-0.84%
1 jan 1982 ano
0.057
-0.061
-51.75%
1 jan 1983 ano
0.082
+0.026
45.06%
1 jan 1984 ano
0.099
+0.017
20.59%
1 jan 1985 ano
0.221
+0.122
123.47%
1 jan 1986 ano
0.352
+0.131
59.04%
1 jan 1987 ano
0.472
+0.12
33.94%
1 jan 1988 ano
0.612
+0.14
29.75%
1 jan 1989 ano
0.692
+0.08
13.14%
1 jan 1990 ano
0.749
+0.057
8.17%
1 jan 1991 ano
0.67
-0.079
-10.59%
1 jan 1992 ano
0.788
+0.119
17.75%
1 jan 1993 ano
0.86
+0.072
9.07%
1 jan 1994 ano
0.861
+0.001
0.13%
1 jan 1995 ano
1.068
+0.207
24.08%
1 jan 1996 ano
1.065
-0.004
-0.36%
1 jan 1997 ano
1.436
+0.371
34.87%
1 jan 1998 ano
1.73
+0.294
20.46%
1 jan 1999 ano
1.767
+0.038
2.18%
1 jan 2000 ano
1.866
+0.098
5.56%
1 jan 2008 ano
3.007
+1.141
61.19%
1 jan 2010 ano
2.898
-0.109
-3.63%
1 jan 2011 ano
2.727
-0.17
-5.88%
1 jan 2012 ano
3.059
+0.332
12.16%
1 jan 2013 ano
3.623
+0.564
18.44%
1 jan 2014 ano
3.976
+0.353
9.74%
1 jan 2015 ano
4.252
+0.276
6.94%
Classificação de países por estatísticas atuais por anos


Comentários: