29
/pt/
pt
AIzaSyAYiBZKx7MnpbEhh9jyipgxe19OcubqV5w
April 1, 2024
227468
Qatar
QAT
true
2
1
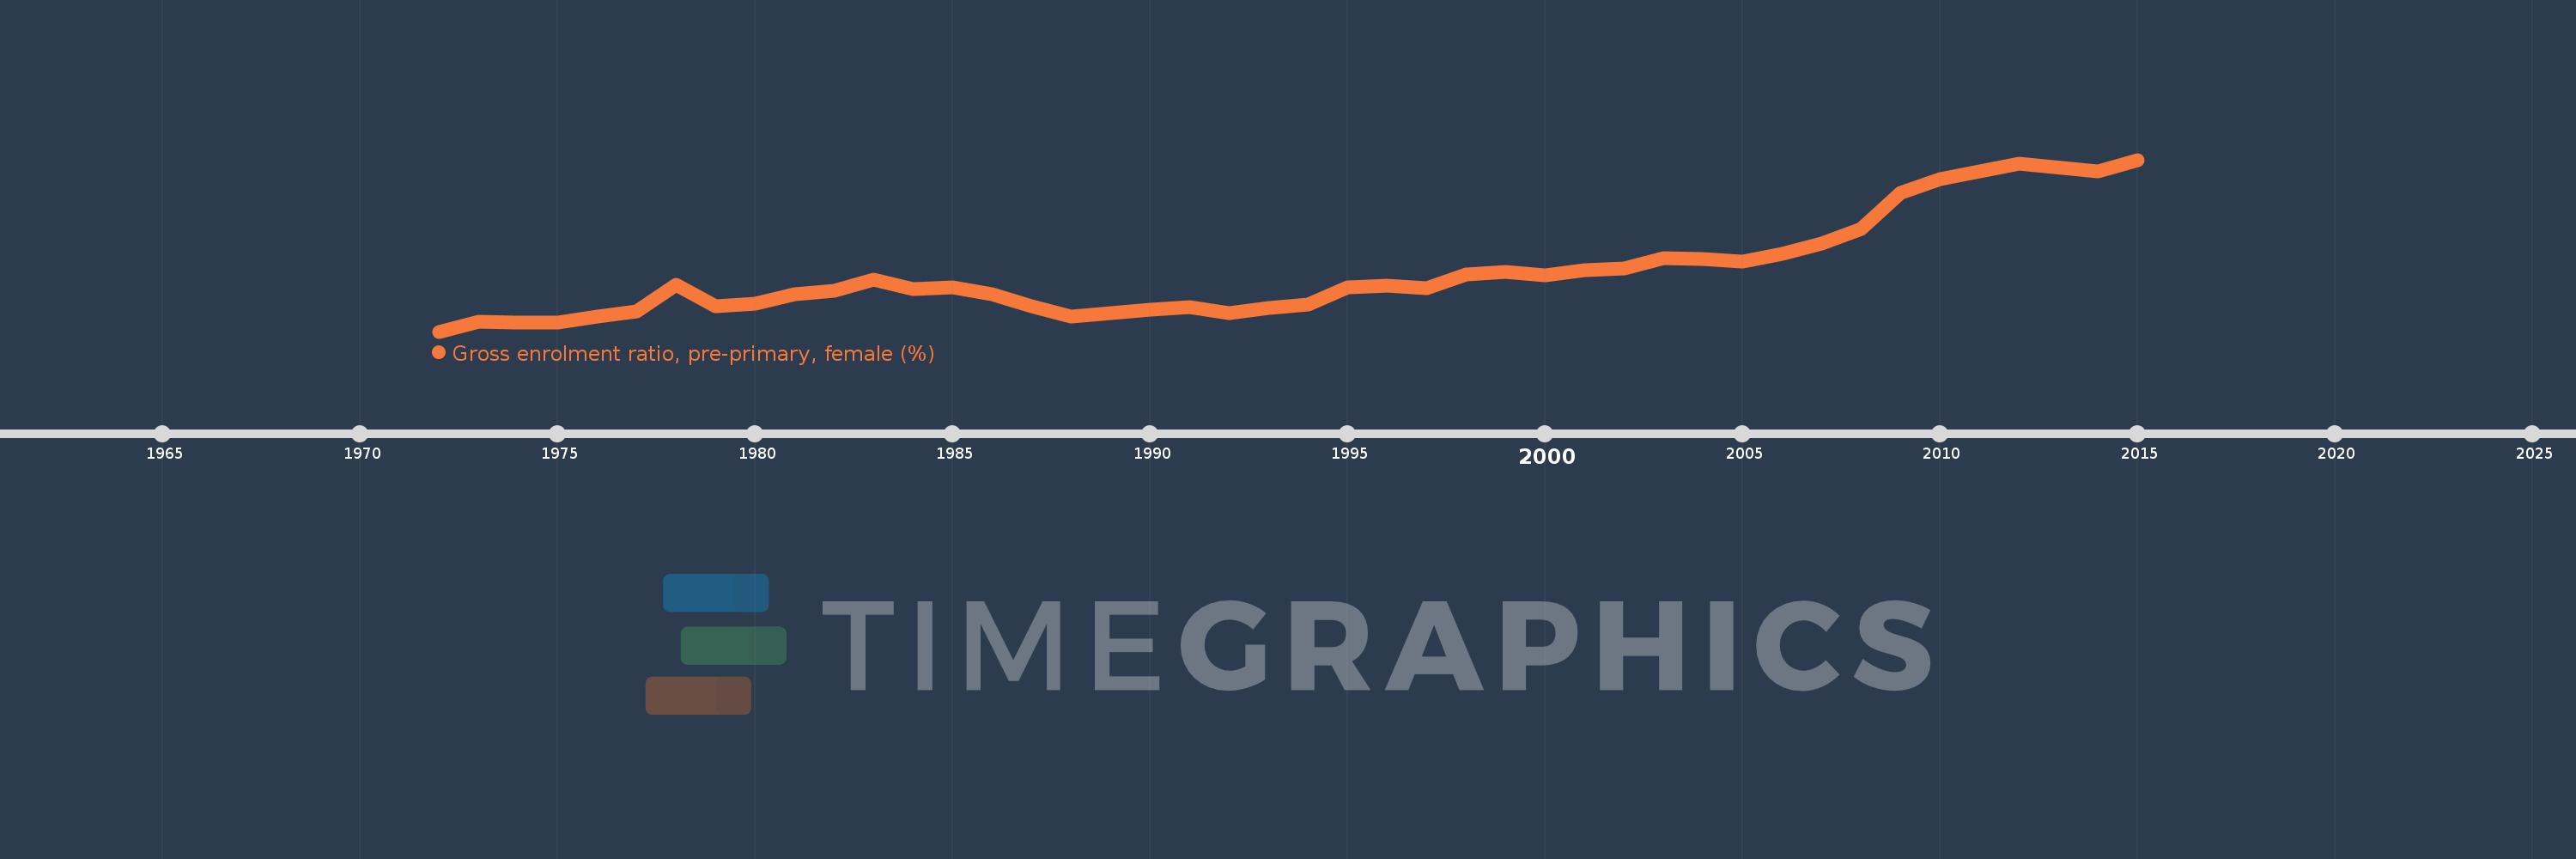
Gross enrolment ratio, pre-primary, female (%)
2015,2014,2012,2010,2009,2008,2007,2006,2005,2004,2003,2002,2001,2000,1999,1998,1997,1996,1995,1994,1993,1992,1991,1990,1989,1988,1987,1986,1985,1984,1983,1982,1981,1980,1979,1978,1977,1976,1975,1974,1973,1972
Estas estatísticas em outros países:
AfghanistanAlbaniaAlgeriaAndorraAngolaAntigua and BarbudaArab WorldArgentinaArmeniaArubaAustraliaAustriaAzerbaijanBahamas, TheBahrainBangladeshBarbadosBelarusBelgiumBelizeBeninBermudaBhutanBoliviaBosnia and HerzegovinaBotswanaBrazilBrunei DarussalamBulgariaBurkina FasoBurundiCabo VerdeCambodiaCameroonCanadaCaribbean small statesCentral African RepublicCentral Europe and the BalticsChadChileChinaColombiaComorosCongo, Dem. Rep.Congo, Rep.Costa RicaCote d'IvoireCroatiaCubaCyprusCzech RepublicDenmarkDjiboutiDominicaDominican RepublicEarly-demographic dividendEast Asia & PacificEast Asia & Pacific (excluding high income)East Asia & Pacific (IDA & IBRD countries)EcuadorEgypt, Arab Rep.El SalvadorEquatorial GuineaEritreaEstoniaEthiopiaEuro areaEurope & Central AsiaEurope & Central Asia (excluding high income)Europe & Central Asia (IDA & IBRD countries)European UnionFijiFinlandFragile and conflict affected situationsFranceGabonGambia, TheGeorgiaGermanyGhanaGreeceGrenadaGuatemalaGuineaGuinea-BissauGuyanaHeavily indebted poor countries (HIPC)High incomeHondurasHong Kong SAR, ChinaHungaryIBRD onlyIcelandIDA & IBRD totalIDA blendIDA onlyIDA totalIndiaIndonesiaIran, Islamic Rep.IraqIrelandIsraelItalyJamaicaJapanJordanKazakhstanKenyaKorea, Dem. People’s Rep.Korea, Rep.KuwaitKyrgyz RepublicLao PDRLate-demographic dividendLatin America & Caribbean Latin America & Caribbean (excluding high income)Latin America & the Caribbean (IDA & IBRD countries)LatviaLeast developed countries: UN classificationLebanonLesothoLiberiaLibyaLiechtensteinLithuaniaLow & middle incomeLow incomeLower middle incomeLuxembourgMacao SAR, ChinaMacedonia, FYRMadagascarMaldivesMaliMaltaMarshall IslandsMauritaniaMauritiusMexicoMicronesia, Fed. Sts.Middle East & North AfricaMiddle East & North Africa (excluding high income)Middle East & North Africa (IDA & IBRD countries)Middle incomeMoldovaMongoliaMontenegroMoroccoMozambiqueMyanmarNamibiaNauruNepalNetherlandsNew ZealandNicaraguaNigerNigeriaNorth AmericaNorwayOECD membersOmanOther small statesPacific island small statesPakistanPalauPanamaPapua New GuineaParaguayPeruPhilippinesPolandPortugalPost-demographic dividendPre-demographic dividendPuerto RicoQatarRomaniaRussian FederationRwandaSamoaSan MarinoSao Tome and PrincipeSaudi ArabiaSenegalSerbiaSeychellesSierra LeoneSlovak RepublicSloveniaSmall statesSolomon IslandsSomaliaSouth AfricaSouth AsiaSouth Asia (IDA & IBRD)South SudanSpainSri LankaSt. Kitts and NevisSt. LuciaSt. Vincent and the GrenadinesSub-Saharan Africa Sub-Saharan Africa (excluding high income)Sub-Saharan Africa (IDA & IBRD countries)SudanSurinameSwazilandSwedenSwitzerlandSyrian Arab RepublicTajikistanTanzaniaThailandTimor-LesteTogoTongaTrinidad and TobagoTunisiaTurkeyTurkmenistanTuvaluUgandaUkraineUnited Arab EmiratesUnited KingdomUnited StatesUpper middle incomeUruguayUzbekistanVanuatuVenezuela, RBVietnamWest Bank and GazaWorldYemen, Rep.Zimbabwe Linha do tempo:
Nesta escala de tempo está apresentado um gráfico de 1972 ano até 2015 ano Qatar. Dados de 1971 ano ausente. O número de observações reais por data: 42.
Fonte (nome):
Indicadores de desenvolvimento mundial
Fonte (organização):
UNESCO Institute for Statistics
Categorias:
Education, Gender
Foi atualizado:
23 abr 2017 ano
Indicadores de alterações dos valores ao longo dos anos
Mínimo:
10.839
1 jan 1972 ano
Máximo:
58.494
1 jan 2015 ano
Na data de observação
Valor
Mudança absoluta
A alteração em relação ao valor anterior
1 jan 1972 ano
10.839
+10.839
0.0%
1 jan 1973 ano
13.653
+2.814
25.96%
1 jan 1974 ano
13.331
-0.322
-2.36%
1 jan 1975 ano
13.382
+0.051
0.38%
1 jan 1976 ano
14.988
+1.605
12.0%
1 jan 1977 ano
16.37
+1.383
9.23%
1 jan 1978 ano
23.707
+7.337
44.82%
1 jan 1979 ano
17.794
-5.913
-24.94%
1 jan 1980 ano
18.681
+0.887
4.98%
1 jan 1981 ano
21.218
+2.537
13.58%
1 jan 1982 ano
22.13
+0.913
4.3%
1 jan 1983 ano
25.251
+3.121
14.1%
1 jan 1984 ano
22.642
-2.61
-10.34%
1 jan 1985 ano
22.997
+0.355
1.57%
1 jan 1986 ano
21.217
-1.779
-7.74%
1 jan 1987 ano
17.912
-3.306
-15.58%
1 jan 1988 ano
15.044
-2.868
-16.01%
1 jan 1989 ano
15.859
+0.814
5.41%
1 jan 1990 ano
17.015
+1.156
7.29%
1 jan 1991 ano
17.73
+0.716
4.21%
1 jan 1992 ano
15.881
-1.85
-10.43%
1 jan 1993 ano
17.324
+1.443
9.09%
1 jan 1994 ano
18.345
+1.021
5.89%
1 jan 1995 ano
23.037
+4.692
25.58%
1 jan 1996 ano
23.483
+0.446
1.94%
1 jan 1997 ano
22.836
-0.647
-2.75%
1 jan 1998 ano
26.62
+3.784
16.57%
1 jan 1999 ano
27.316
+0.696
2.61%
1 jan 2000 ano
26.511
-0.805
-2.95%
1 jan 2001 ano
27.913
+1.402
5.29%
1 jan 2002 ano
28.278
+0.365
1.31%
1 jan 2003 ano
31.303
+3.025
10.7%
1 jan 2004 ano
31.048
-0.255
-0.82%
1 jan 2005 ano
30.256
-0.791
-2.55%
1 jan 2006 ano
32.518
+2.262
7.48%
1 jan 2007 ano
35.337
+2.818
8.67%
1 jan 2008 ano
39.263
+3.926
11.11%
1 jan 2009 ano
49.362
+10.099
25.72%
1 jan 2010 ano
53.22
+3.858
7.82%
1 jan 2012 ano
57.414
+4.194
7.88%
1 jan 2014 ano
55.322
-2.092
-3.64%
1 jan 2015 ano
58.494
+3.172
5.73%
Classificação de países por estatísticas atuais por anos


Comentários: