29
/pt/
pt
AIzaSyAYiBZKx7MnpbEhh9jyipgxe19OcubqV5w
April 1, 2024
94856
Burkina Faso
BFA
true
2
1
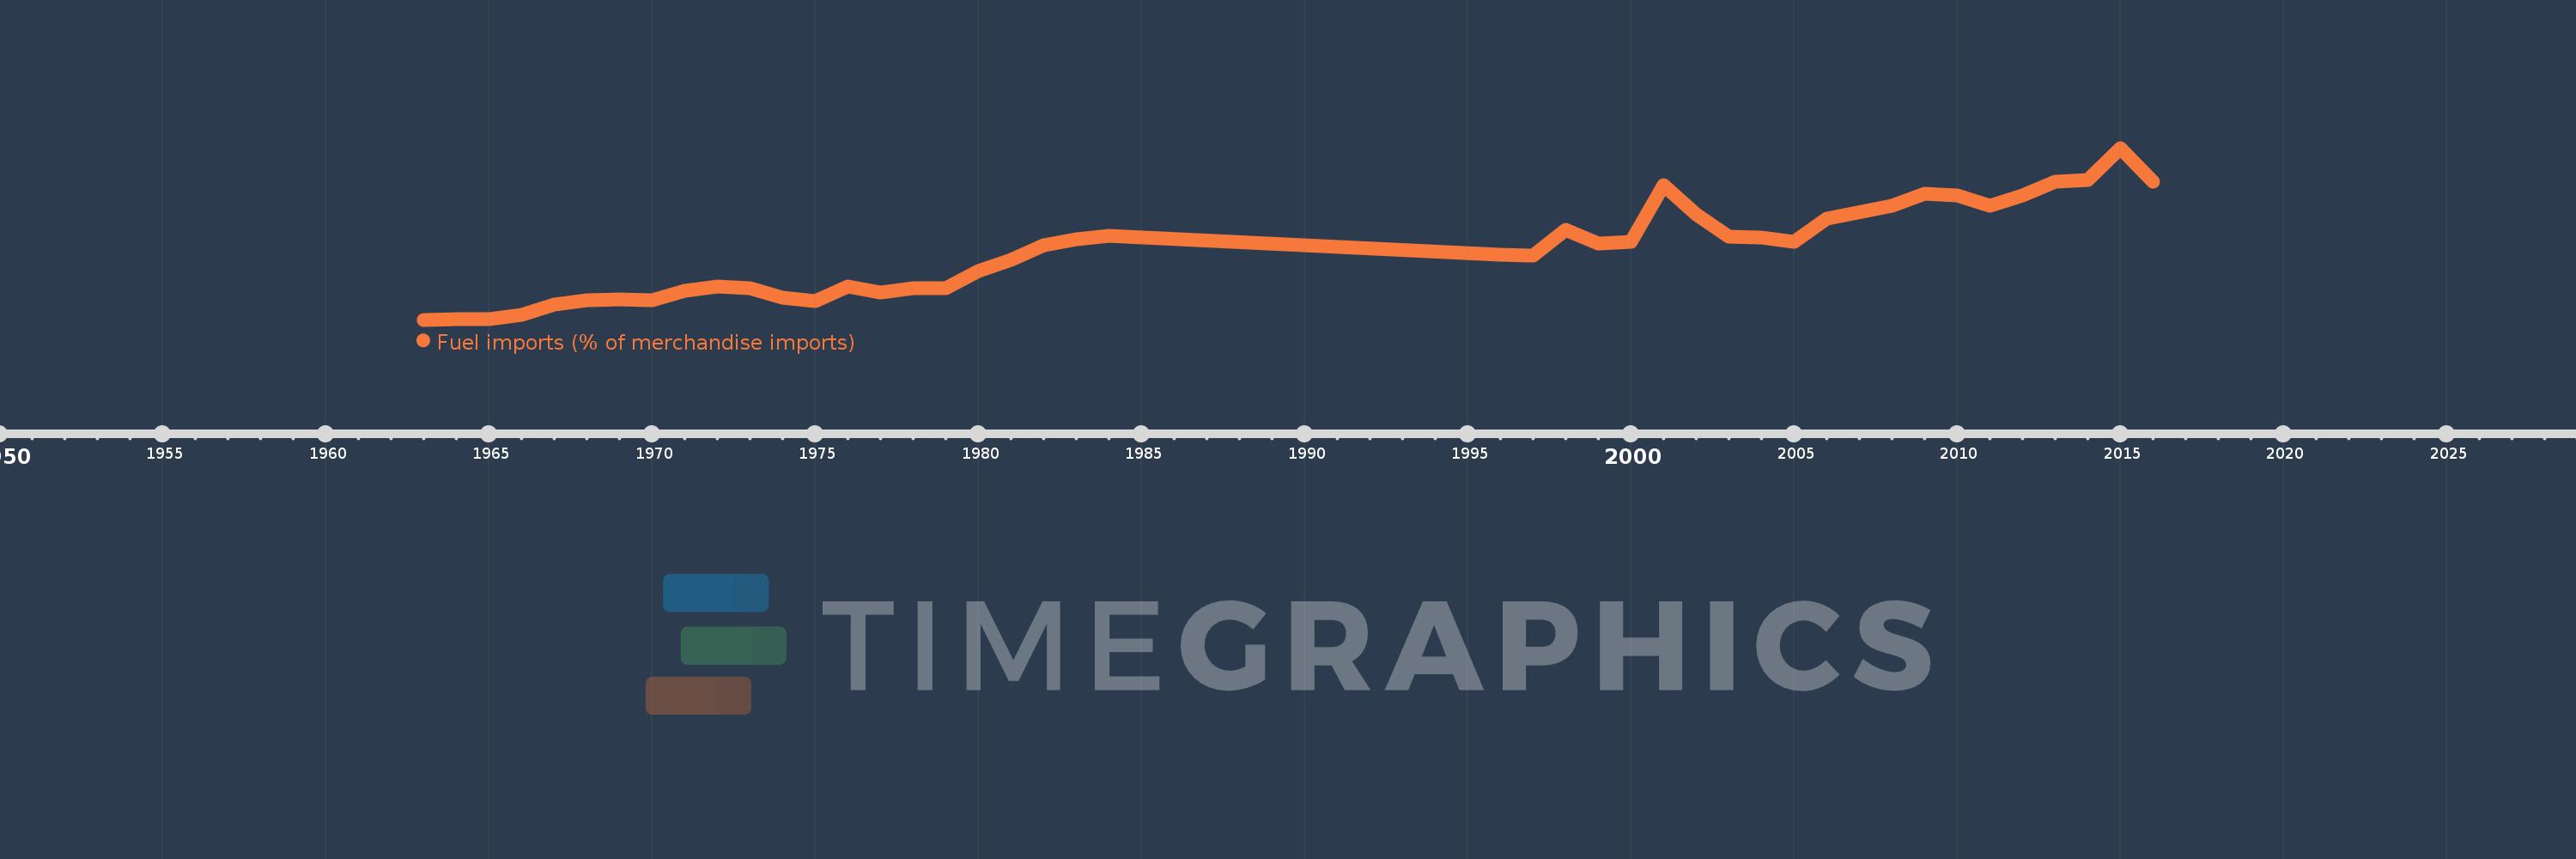
Fuel imports (% of merchandise imports)
2016,2015,2014,2013,2012,2011,2010,2009,2008,2006,2005,2004,2003,2002,2001,2000,1999,1998,1997,1996,1984,1983,1982,1981,1980,1979,1978,1977,1976,1975,1974,1973,1972,1971,1970,1969,1968,1967,1966,1965,1964,1963
Estas estatísticas em outros países:
AfghanistanAlbaniaAlgeriaAndorraAngolaAntigua and BarbudaArab WorldArgentinaArmeniaArubaAustraliaAustriaAzerbaijanBahamas, TheBahrainBangladeshBarbadosBelarusBelgiumBelizeBeninBermudaBhutanBoliviaBosnia and HerzegovinaBotswanaBrazilBrunei DarussalamBulgariaBurkina FasoBurundiCabo VerdeCambodiaCameroonCanadaCaribbean small statesCayman IslandsCentral African RepublicCentral Europe and the BalticsChadChileChinaColombiaComorosCongo, Dem. Rep.Congo, Rep.Costa RicaCote d'IvoireCroatiaCubaCyprusCzech RepublicDenmarkDjiboutiDominicaDominican RepublicEarly-demographic dividendEast Asia & PacificEast Asia & Pacific (excluding high income)East Asia & Pacific (IDA & IBRD countries)EcuadorEgypt, Arab Rep.El SalvadorEquatorial GuineaEritreaEstoniaEthiopiaEuro areaEurope & Central AsiaEurope & Central Asia (excluding high income)Europe & Central Asia (IDA & IBRD countries)European UnionFaroe IslandsFijiFinlandFragile and conflict affected situationsFranceFrench PolynesiaGabonGambia, TheGeorgiaGermanyGhanaGreeceGreenlandGrenadaGuatemalaGuineaGuinea-BissauGuyanaHaitiHeavily indebted poor countries (HIPC)High incomeHondurasHong Kong SAR, ChinaHungaryIBRD onlyIcelandIDA & IBRD totalIDA blendIDA onlyIDA totalIndiaIndonesiaIran, Islamic Rep.IraqIrelandIsraelItalyJamaicaJapanJordanKazakhstanKenyaKiribatiKorea, Rep.KuwaitKyrgyz RepublicLao PDRLate-demographic dividendLatin America & Caribbean Latin America & Caribbean (excluding high income)Latin America & the Caribbean (IDA & IBRD countries)LatviaLeast developed countries: UN classificationLebanonLesothoLiberiaLibyaLithuaniaLow & middle incomeLow incomeLower middle incomeLuxembourgMacao SAR, ChinaMacedonia, FYRMadagascarMalawiMalaysiaMaldivesMaliMaltaMauritaniaMauritiusMexicoMiddle East & North AfricaMiddle East & North Africa (excluding high income)Middle East & North Africa (IDA & IBRD countries)Middle incomeMoldovaMongoliaMoroccoMozambiqueMyanmarNamibiaNepalNetherlandsNew CaledoniaNew ZealandNicaraguaNigerNigeriaNorth AmericaNorwayOECD membersOmanOther small statesPacific island small statesPakistanPalauPanamaPapua New GuineaParaguayPeruPhilippinesPolandPortugalPost-demographic dividendPre-demographic dividendQatarRomaniaRussian FederationRwandaSamoaSao Tome and PrincipeSaudi ArabiaSenegalSerbiaSeychellesSierra LeoneSingaporeSlovak RepublicSloveniaSmall statesSolomon IslandsSomaliaSouth AfricaSouth AsiaSouth Asia (IDA & IBRD)SpainSri LankaSt. Kitts and NevisSt. LuciaSt. Vincent and the GrenadinesSub-Saharan Africa Sub-Saharan Africa (excluding high income)Sub-Saharan Africa (IDA & IBRD countries)SudanSurinameSwazilandSwedenSwitzerlandSyrian Arab RepublicTajikistanTanzaniaThailandTimor-LesteTogoTongaTrinidad and TobagoTunisiaTurkeyTurkmenistanTurks and Caicos IslandsTuvaluUgandaUkraineUnited Arab EmiratesUnited KingdomUnited StatesUpper middle incomeUruguayVanuatuVenezuela, RBVietnamVirgin Islands (U.S.)WorldYemen, Rep.ZambiaZimbabwe Linha do tempo:
Nesta escala de tempo está apresentado um gráfico de 1963 ano até 2016 ano Burkina Faso. Dados de 1962 ano ausente. O número de observações reais por data: 42.
Fonte (nome):
Indicadores de desenvolvimento mundial
Fonte (organização):
World Bank staff estimates from the Comtrade database maintained by the United Nations Statistics Division.
Categorias:
Energy & Mining, Private Sector, Trade
Foi atualizado:
23 abr 2017 ano
Indicadores de alterações dos valores ao longo dos anos
Mínimo:
3.426
1 jan 1963 ano
Máximo:
31.34
1 jan 2015 ano
Na data de observação
Valor
Mudança absoluta
A alteração em relação ao valor anterior
1 jan 1963 ano
3.426
+3.426
0.0%
1 jan 1964 ano
3.499
+0.073
2.13%
1 jan 1965 ano
3.545
+0.046
1.31%
1 jan 1966 ano
4.257
+0.713
20.11%
1 jan 1967 ano
5.879
+1.622
38.1%
1 jan 1968 ano
6.53
+0.651
11.07%
1 jan 1969 ano
6.736
+0.206
3.15%
1 jan 1970 ano
6.623
-0.113
-1.68%
1 jan 1971 ano
8.198
+1.575
23.78%
1 jan 1972 ano
8.844
+0.647
7.89%
1 jan 1973 ano
8.561
-0.283
-3.2%
1 jan 1974 ano
7.07
-1.491
-17.42%
1 jan 1975 ano
6.482
-0.588
-8.32%
1 jan 1976 ano
8.842
+2.36
36.41%
1 jan 1977 ano
7.845
-0.997
-11.28%
1 jan 1978 ano
8.486
+0.641
8.17%
1 jan 1979 ano
8.511
+0.025
0.3%
1 jan 1980 ano
11.328
+2.817
33.1%
1 jan 1981 ano
13.213
+1.885
16.64%
1 jan 1982 ano
15.553
+2.34
17.71%
1 jan 1983 ano
16.468
+0.915
5.88%
1 jan 1984 ano
17.119
+0.651
3.95%
1 jan 1996 ano
13.996
-3.123
-18.24%
1 jan 1997 ano
13.865
-0.131
-0.94%
1 jan 1998 ano
17.993
+4.128
29.77%
1 jan 1999 ano
15.783
-2.21
-12.28%
1 jan 2000 ano
16.042
+0.259
1.64%
1 jan 2001 ano
25.247
+9.206
57.39%
1 jan 2002 ano
20.594
-4.654
-18.43%
1 jan 2003 ano
16.891
-3.703
-17.98%
1 jan 2004 ano
16.849
-0.041
-0.25%
1 jan 2005 ano
16.106
-0.743
-4.41%
1 jan 2006 ano
19.884
+3.778
23.46%
1 jan 2008 ano
21.907
+2.023
10.18%
1 jan 2009 ano
23.875
+1.967
8.98%
1 jan 2010 ano
23.584
-0.291
-1.22%
1 jan 2011 ano
21.985
-1.599
-6.78%
1 jan 2012 ano
23.645
+1.66
7.55%
1 jan 2013 ano
25.873
+2.228
9.42%
1 jan 2014 ano
26.13
+0.257
0.99%
1 jan 2015 ano
31.34
+5.21
19.94%
1 jan 2016 ano
25.821
-5.52
-17.61%
Classificação de países por estatísticas atuais por anos


Comentários: