29
/pt/
pt
AIzaSyAYiBZKx7MnpbEhh9jyipgxe19OcubqV5w
April 1, 2024
266831
Trinidad and Tobago
TTO
true
2
1
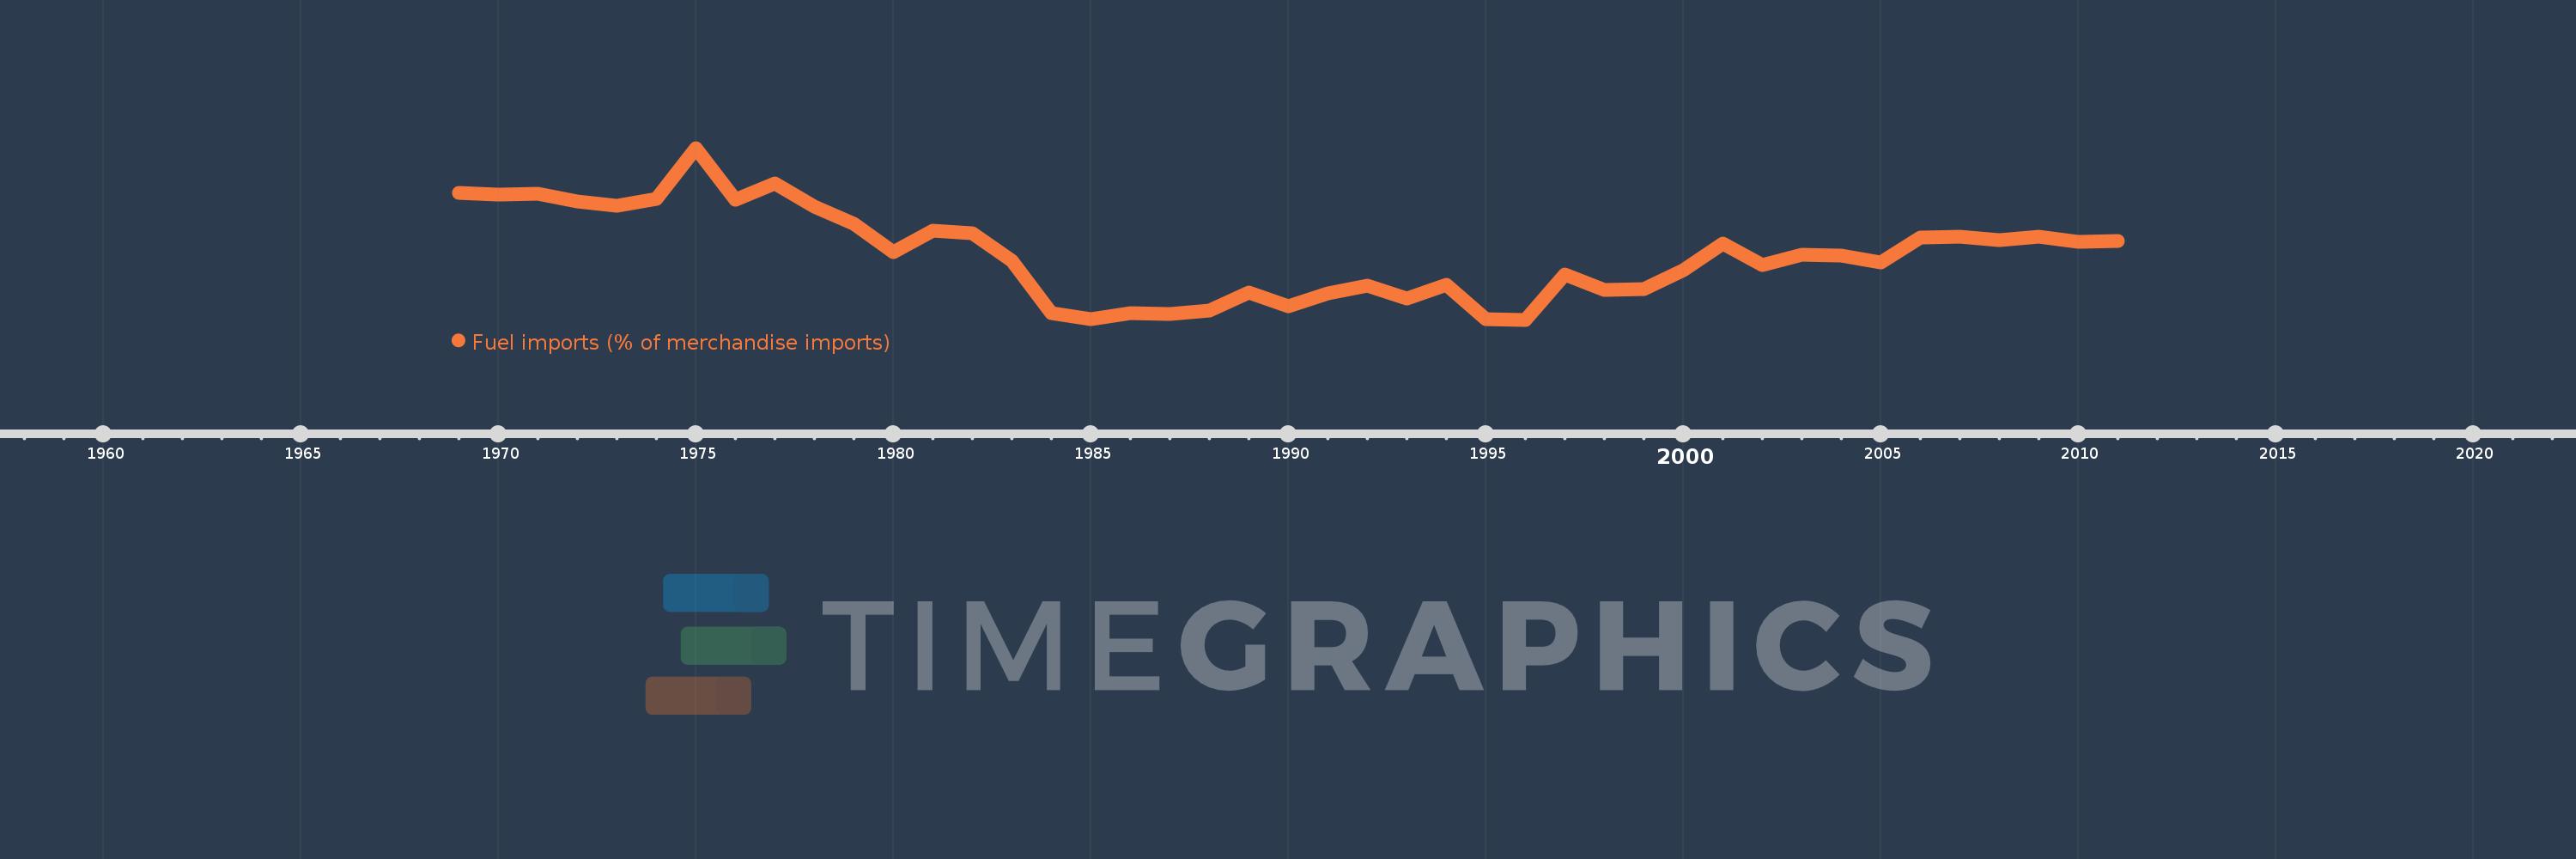
Fuel imports (% of merchandise imports)
2011,2010,2009,2008,2007,2006,2005,2004,2003,2002,2001,2000,1999,1998,1997,1996,1995,1994,1993,1992,1991,1990,1989,1988,1987,1986,1985,1984,1983,1982,1981,1980,1979,1978,1977,1976,1975,1974,1973,1972,1971,1970,1969
Estas estatísticas em outros países:
AfghanistanAlbaniaAlgeriaAndorraAngolaAntigua and BarbudaArab WorldArgentinaArmeniaArubaAustraliaAustriaAzerbaijanBahamas, TheBahrainBangladeshBarbadosBelarusBelgiumBelizeBeninBermudaBhutanBoliviaBosnia and HerzegovinaBotswanaBrazilBrunei DarussalamBulgariaBurkina FasoBurundiCabo VerdeCambodiaCameroonCanadaCaribbean small statesCayman IslandsCentral African RepublicCentral Europe and the BalticsChadChileChinaColombiaComorosCongo, Dem. Rep.Congo, Rep.Costa RicaCote d'IvoireCroatiaCubaCyprusCzech RepublicDenmarkDjiboutiDominicaDominican RepublicEarly-demographic dividendEast Asia & PacificEast Asia & Pacific (excluding high income)East Asia & Pacific (IDA & IBRD countries)EcuadorEgypt, Arab Rep.El SalvadorEquatorial GuineaEritreaEstoniaEthiopiaEuro areaEurope & Central AsiaEurope & Central Asia (excluding high income)Europe & Central Asia (IDA & IBRD countries)European UnionFaroe IslandsFijiFinlandFragile and conflict affected situationsFranceFrench PolynesiaGabonGambia, TheGeorgiaGermanyGhanaGreeceGreenlandGrenadaGuatemalaGuineaGuinea-BissauGuyanaHaitiHeavily indebted poor countries (HIPC)High incomeHondurasHong Kong SAR, ChinaHungaryIBRD onlyIcelandIDA & IBRD totalIDA blendIDA onlyIDA totalIndiaIndonesiaIran, Islamic Rep.IraqIrelandIsraelItalyJamaicaJapanJordanKazakhstanKenyaKiribatiKorea, Rep.KuwaitKyrgyz RepublicLao PDRLate-demographic dividendLatin America & Caribbean Latin America & Caribbean (excluding high income)Latin America & the Caribbean (IDA & IBRD countries)LatviaLeast developed countries: UN classificationLebanonLesothoLiberiaLibyaLithuaniaLow & middle incomeLow incomeLower middle incomeLuxembourgMacao SAR, ChinaMacedonia, FYRMadagascarMalawiMalaysiaMaldivesMaliMaltaMauritaniaMauritiusMexicoMiddle East & North AfricaMiddle East & North Africa (excluding high income)Middle East & North Africa (IDA & IBRD countries)Middle incomeMoldovaMongoliaMoroccoMozambiqueMyanmarNamibiaNepalNetherlandsNew CaledoniaNew ZealandNicaraguaNigerNigeriaNorth AmericaNorwayOECD membersOmanOther small statesPacific island small statesPakistanPalauPanamaPapua New GuineaParaguayPeruPhilippinesPolandPortugalPost-demographic dividendPre-demographic dividendQatarRomaniaRussian FederationRwandaSamoaSao Tome and PrincipeSaudi ArabiaSenegalSerbiaSeychellesSierra LeoneSingaporeSlovak RepublicSloveniaSmall statesSolomon IslandsSomaliaSouth AfricaSouth AsiaSouth Asia (IDA & IBRD)SpainSri LankaSt. Kitts and NevisSt. LuciaSt. Vincent and the GrenadinesSub-Saharan Africa Sub-Saharan Africa (excluding high income)Sub-Saharan Africa (IDA & IBRD countries)SudanSurinameSwazilandSwedenSwitzerlandSyrian Arab RepublicTajikistanTanzaniaThailandTimor-LesteTogoTongaTrinidad and TobagoTunisiaTurkeyTurkmenistanTurks and Caicos IslandsTuvaluUgandaUkraineUnited Arab EmiratesUnited KingdomUnited StatesUpper middle incomeUruguayVanuatuVenezuela, RBVietnamVirgin Islands (U.S.)WorldYemen, Rep.ZambiaZimbabwe Linha do tempo:
Nesta escala de tempo está apresentado um gráfico de 1969 ano até 2011 ano Trinidad and Tobago. Dados de 1968 ano ausente. O número de observações reais por data: 43.
Fonte (nome):
Indicadores de desenvolvimento mundial
Fonte (organização):
World Bank staff estimates from the Comtrade database maintained by the United Nations Statistics Division.
Categorias:
Energy & Mining, Private Sector, Trade
Foi atualizado:
23 abr 2017 ano
Indicadores de alterações dos valores ao longo dos anos
Mínimo:
0.549
1 jan 1996 ano
Máximo:
71.908
1 jan 1975 ano
Na data de observação
Valor
Mudança absoluta
A alteração em relação ao valor anterior
1 jan 1969 ano
53.114
+53.114
0.0%
1 jan 1970 ano
52.543
-0.571
-1.07%
1 jan 1971 ano
52.916
+0.372
0.71%
1 jan 1972 ano
49.846
-3.07
-5.8%
1 jan 1973 ano
47.778
-2.068
-4.15%
1 jan 1974 ano
50.76
+2.982
6.24%
1 jan 1975 ano
71.908
+21.149
41.66%
1 jan 1976 ano
50.562
-21.346
-29.69%
1 jan 1977 ano
57.251
+6.689
13.23%
1 jan 1978 ano
47.607
-9.644
-16.84%
1 jan 1979 ano
40.312
-7.295
-15.32%
1 jan 1980 ano
28.599
-11.713
-29.06%
1 jan 1981 ano
37.668
+9.07
31.71%
1 jan 1982 ano
36.607
-1.061
-2.82%
1 jan 1983 ano
25.19
-11.417
-31.19%
1 jan 1984 ano
3.202
-21.987
-87.29%
1 jan 1985 ano
0.749
-2.453
-76.6%
1 jan 1986 ano
3.318
+2.568
342.77%
1 jan 1987 ano
2.833
-0.485
-14.62%
1 jan 1988 ano
4.297
+1.464
51.7%
1 jan 1989 ano
11.913
+7.615
177.22%
1 jan 1990 ano
6.11
-5.802
-48.71%
1 jan 1991 ano
11.388
+5.278
86.38%
1 jan 1992 ano
14.634
+3.245
28.5%
1 jan 1993 ano
9.424
-5.209
-35.6%
1 jan 1994 ano
15.12
+5.695
60.43%
1 jan 1995 ano
0.688
-14.432
-95.45%
1 jan 1996 ano
0.549
-0.14
-20.28%
1 jan 1997 ano
19.203
+18.655
3.4 mil%
1 jan 1998 ano
12.983
-6.22
-32.39%
1 jan 1999 ano
13.138
+0.155
1.19%
1 jan 2000 ano
21.047
+7.909
60.19%
1 jan 2001 ano
32.332
+11.285
53.62%
1 jan 2002 ano
23.455
-8.877
-27.45%
1 jan 2003 ano
27.702
+4.247
18.11%
1 jan 2004 ano
27.239
-0.464
-1.67%
1 jan 2005 ano
24.198
-3.04
-11.16%
1 jan 2006 ano
34.831
+10.633
43.94%
1 jan 2007 ano
35.082
+0.251
0.72%
1 jan 2008 ano
33.536
-1.546
-4.41%
1 jan 2009 ano
35.142
+1.606
4.79%
1 jan 2010 ano
33.003
-2.14
-6.09%
1 jan 2011 ano
33.365
+0.363
1.1%
Classificação de países por estatísticas atuais por anos


Comentários: