30
/pt/
AIzaSyAYiBZKx7MnpbEhh9jyipgxe19OcubqV5w
April 1, 2024
89451
Botswana
BWA
true
2
1
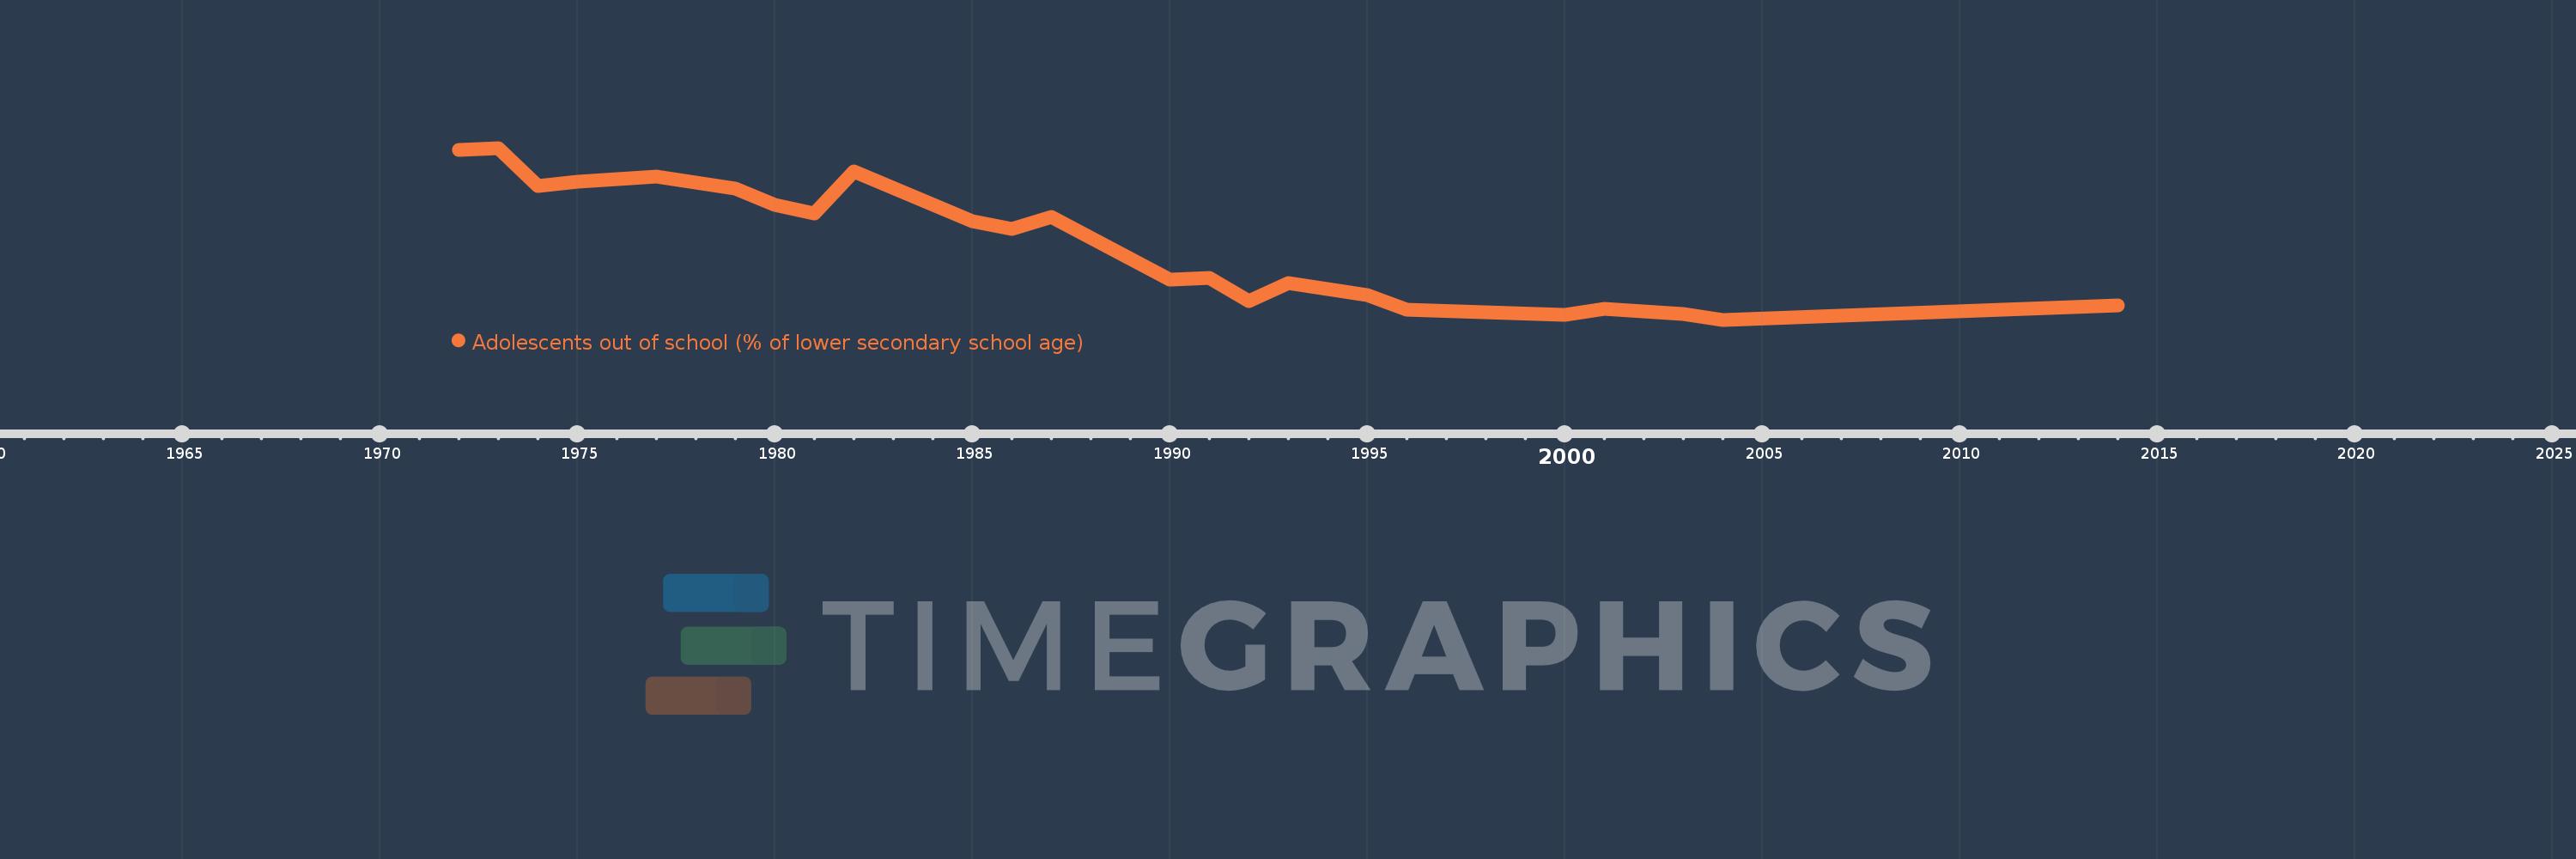
Adolescents out of school (% of lower secondary school age)
2014,2004,2003,2001,2000,1996,1995,1994,1993,1992,1991,1990,1987,1986,1985,1982,1981,1980,1979,1978,1977,1976,1975,1974,1973,1972
