29
/pt/
pt
AIzaSyAYiBZKx7MnpbEhh9jyipgxe19OcubqV5w
April 1, 2024
159124
Ireland
IRL
true
2
1
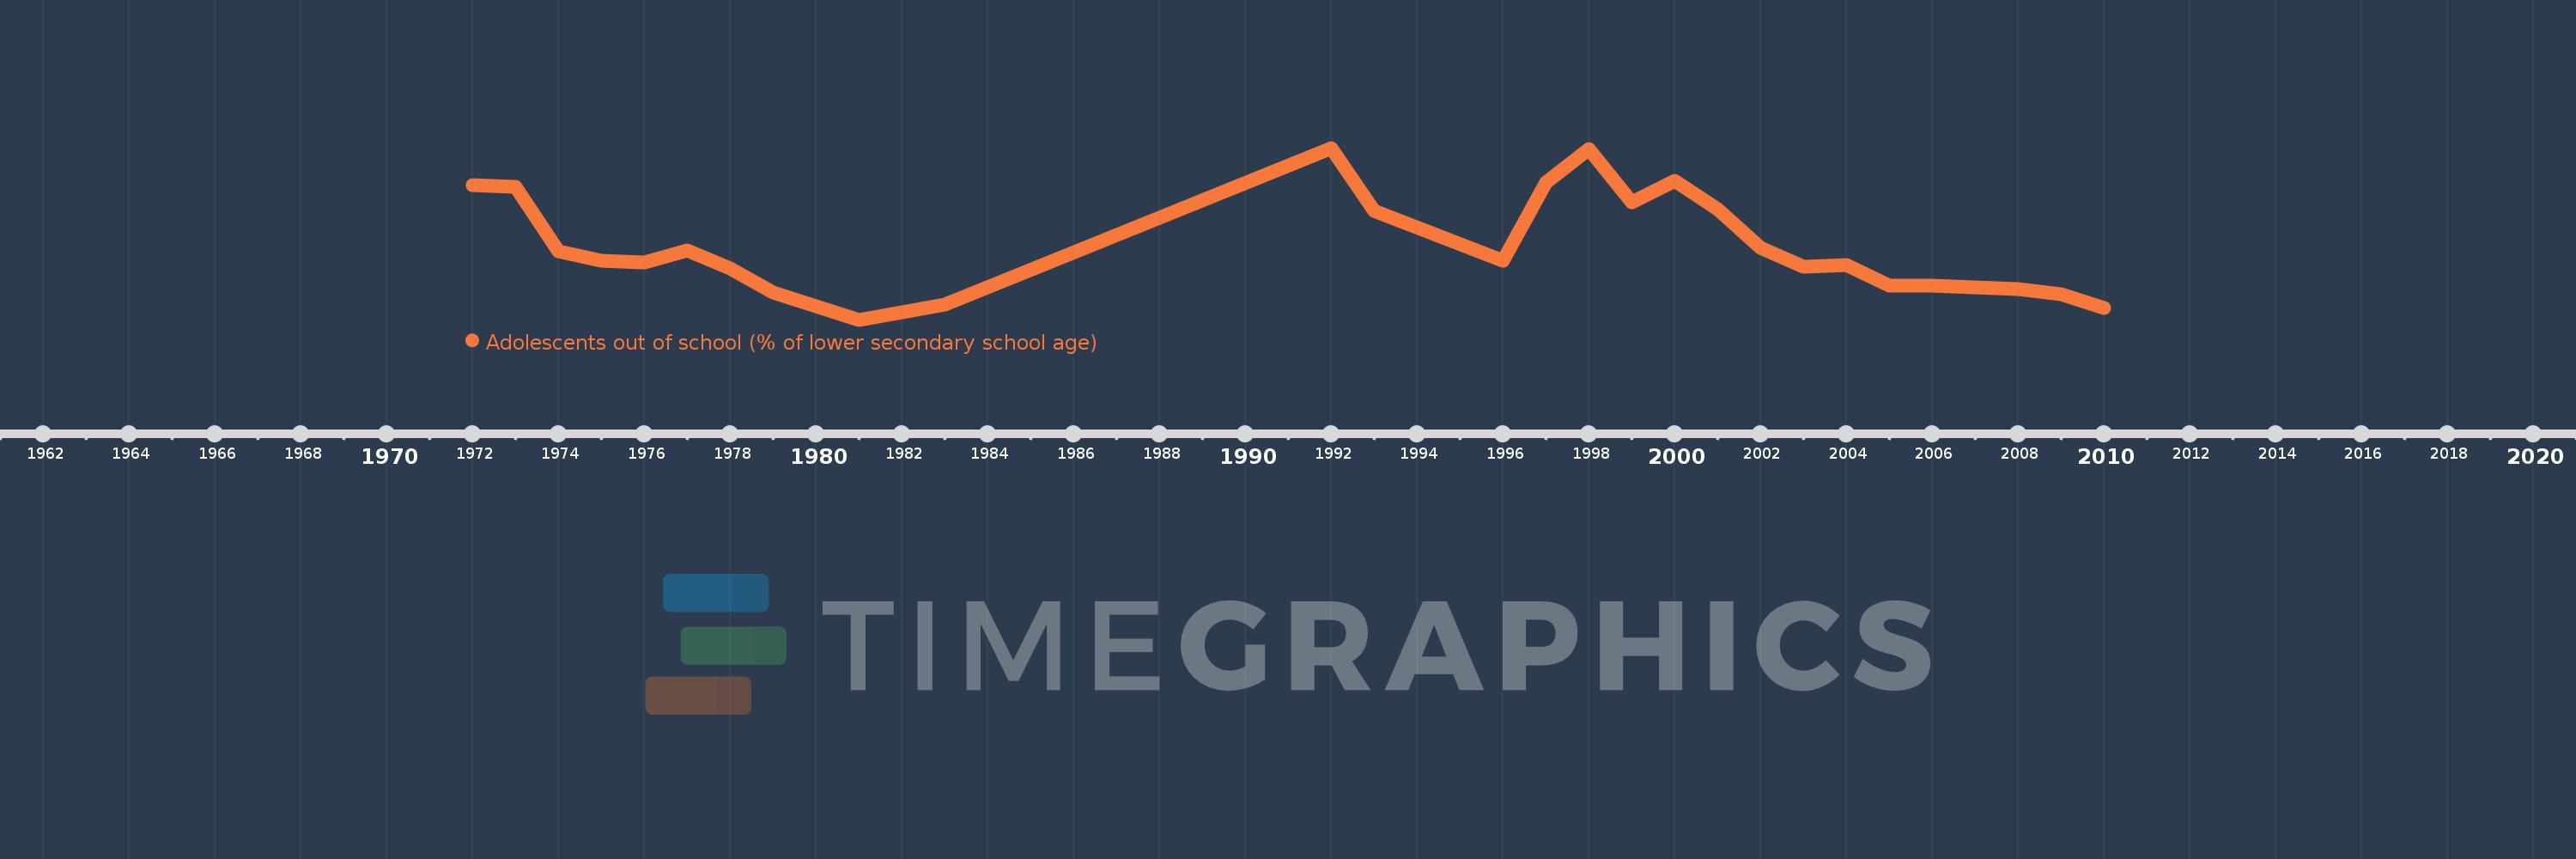
Adolescents out of school (% of lower secondary school age)
2010,2009,2008,2006,2005,2004,2003,2002,2001,2000,1999,1998,1997,1996,1993,1992,1983,1981,1979,1978,1977,1976,1975,1974,1973,1972
Estas estatísticas em outros países:
AfghanistanAlbaniaAlgeriaAngolaAntigua and BarbudaArab WorldArgentinaArmeniaArubaAustraliaAustriaAzerbaijanBahamas, TheBahrainBangladeshBarbadosBelarusBelgiumBelizeBeninBermudaBhutanBoliviaBotswanaBrazilBrunei DarussalamBulgariaBurkina FasoBurundiCabo VerdeCambodiaCameroonCanadaCaribbean small statesCentral African RepublicCentral Europe and the BalticsChadChileColombiaComorosCongo, Dem. Rep.Congo, Rep.Costa RicaCroatiaCubaCyprusDenmarkDjiboutiDominicaDominican RepublicEarly-demographic dividendEast Asia & PacificEast Asia & Pacific (excluding high income)East Asia & Pacific (IDA & IBRD countries)EcuadorEgypt, Arab Rep.El SalvadorEquatorial GuineaEritreaEstoniaEthiopiaEuro areaEurope & Central AsiaEurope & Central Asia (excluding high income)Europe & Central Asia (IDA & IBRD countries)European UnionFijiFinlandFragile and conflict affected situationsFranceGambia, TheGeorgiaGhanaGreeceGrenadaGuatemalaGuineaGuinea-BissauGuyanaHeavily indebted poor countries (HIPC)High incomeHondurasHong Kong SAR, ChinaHungaryIBRD onlyIcelandIDA & IBRD totalIDA blendIDA onlyIDA totalIndiaIndonesiaIran, Islamic Rep.IraqIrelandIsraelItalyJamaicaJapanJordanKazakhstanKenyaKiribatiKorea, Dem. People’s Rep.Korea, Rep.KuwaitKyrgyz RepublicLao PDRLate-demographic dividendLatin America & Caribbean Latin America & Caribbean (excluding high income)Latin America & the Caribbean (IDA & IBRD countries)LatviaLeast developed countries: UN classificationLebanonLesothoLibyaLiechtensteinLithuaniaLow & middle incomeLow incomeLower middle incomeLuxembourgMacao SAR, ChinaMacedonia, FYRMadagascarMalawiMalaysiaMaldivesMaliMaltaMarshall IslandsMauritaniaMauritiusMexicoMiddle East & North AfricaMiddle East & North Africa (excluding high income)Middle East & North Africa (IDA & IBRD countries)Middle incomeMoldovaMongoliaMoroccoMozambiqueMyanmarNamibiaNauruNetherlandsNew ZealandNicaraguaNigerNorth AmericaNorwayOECD membersOmanOther small statesPacific island small statesPakistanPanamaParaguayPeruPhilippinesPolandPortugalPost-demographic dividendPre-demographic dividendPuerto RicoQatarRomaniaRussian FederationSamoaSao Tome and PrincipeSaudi ArabiaSenegalSerbiaSeychellesSierra LeoneSloveniaSmall statesSolomon IslandsSomaliaSouth AfricaSouth AsiaSouth Asia (IDA & IBRD)SpainSri LankaSt. Kitts and NevisSt. LuciaSt. Vincent and the GrenadinesSub-Saharan Africa Sub-Saharan Africa (excluding high income)Sub-Saharan Africa (IDA & IBRD countries)SudanSurinameSwazilandSwedenSwitzerlandSyrian Arab RepublicTajikistanThailandTimor-LesteTogoTongaTrinidad and TobagoTunisiaTurkeyTuvaluUgandaUkraineUnited Arab EmiratesUnited KingdomUnited StatesUpper middle incomeUruguayUzbekistanVanuatuVenezuela, RBVietnamWest Bank and GazaWorldYemen, Rep.Zimbabwe Linha do tempo:
Nesta escala de tempo está apresentado um gráfico de 1972 ano até 2010 ano Ireland. Dados de 1971 ano ausente. O número de observações reais por data: 26.
Fonte (nome):
Indicadores de desenvolvimento mundial
Fonte (organização):
United Nations Educational, Scientific, and Cultural Organization (UNESCO) Institute for Statistics.
Categorias:
Education
Foi atualizado:
23 abr 2017 ano
Indicadores de alterações dos valores ao longo dos anos
Máximo:
7.323
1 jan 1992 ano
Na data de observação
Valor
Mudança absoluta
A alteração em relação ao valor anterior
1 jan 1972 ano
5.72
+5.72
0.0%
1 jan 1973 ano
5.652
-0.068
-1.19%
1 jan 1974 ano
2.918
-2.734
-48.37%
1 jan 1975 ano
2.528
-0.39
-13.36%
1 jan 1976 ano
2.448
-0.08
-3.18%
1 jan 1977 ano
2.963
+0.515
21.05%
1 jan 1978 ano
2.2
-0.763
-25.74%
1 jan 1979 ano
1.157
-1.043
-47.42%
1 jan 1981 ano
0.0
-1.157
-100.0%
1 jan 1983 ano
0.666
+0.666
%
1 jan 1992 ano
7.323
+6.657
999.27%
1 jan 1993 ano
4.64
-2.683
-36.64%
1 jan 1996 ano
2.531
-2.11
-45.47%
1 jan 1997 ano
5.838
+3.308
130.71%
1 jan 1998 ano
7.271
+1.433
24.54%
1 jan 1999 ano
4.993
-2.278
-31.33%
1 jan 2000 ano
5.934
+0.941
18.84%
1 jan 2001 ano
4.7
-1.234
-20.79%
1 jan 2002 ano
3.08
-1.619
-34.46%
1 jan 2003 ano
2.265
-0.816
-26.48%
1 jan 2004 ano
2.338
+0.073
3.23%
1 jan 2005 ano
1.465
-0.873
-37.33%
1 jan 2006 ano
1.439
-0.027
-1.82%
1 jan 2008 ano
1.305
-0.133
-9.26%
1 jan 2009 ano
1.078
-0.227
-17.38%
1 jan 2010 ano
0.517
-0.562
-52.07%
Classificação de países por estatísticas atuais por anos


Comentários: