29
/pt/
pt
AIzaSyAYiBZKx7MnpbEhh9jyipgxe19OcubqV5w
April 1, 2024
88237
Bosnia and Herzegovina
BIH
true
2
1
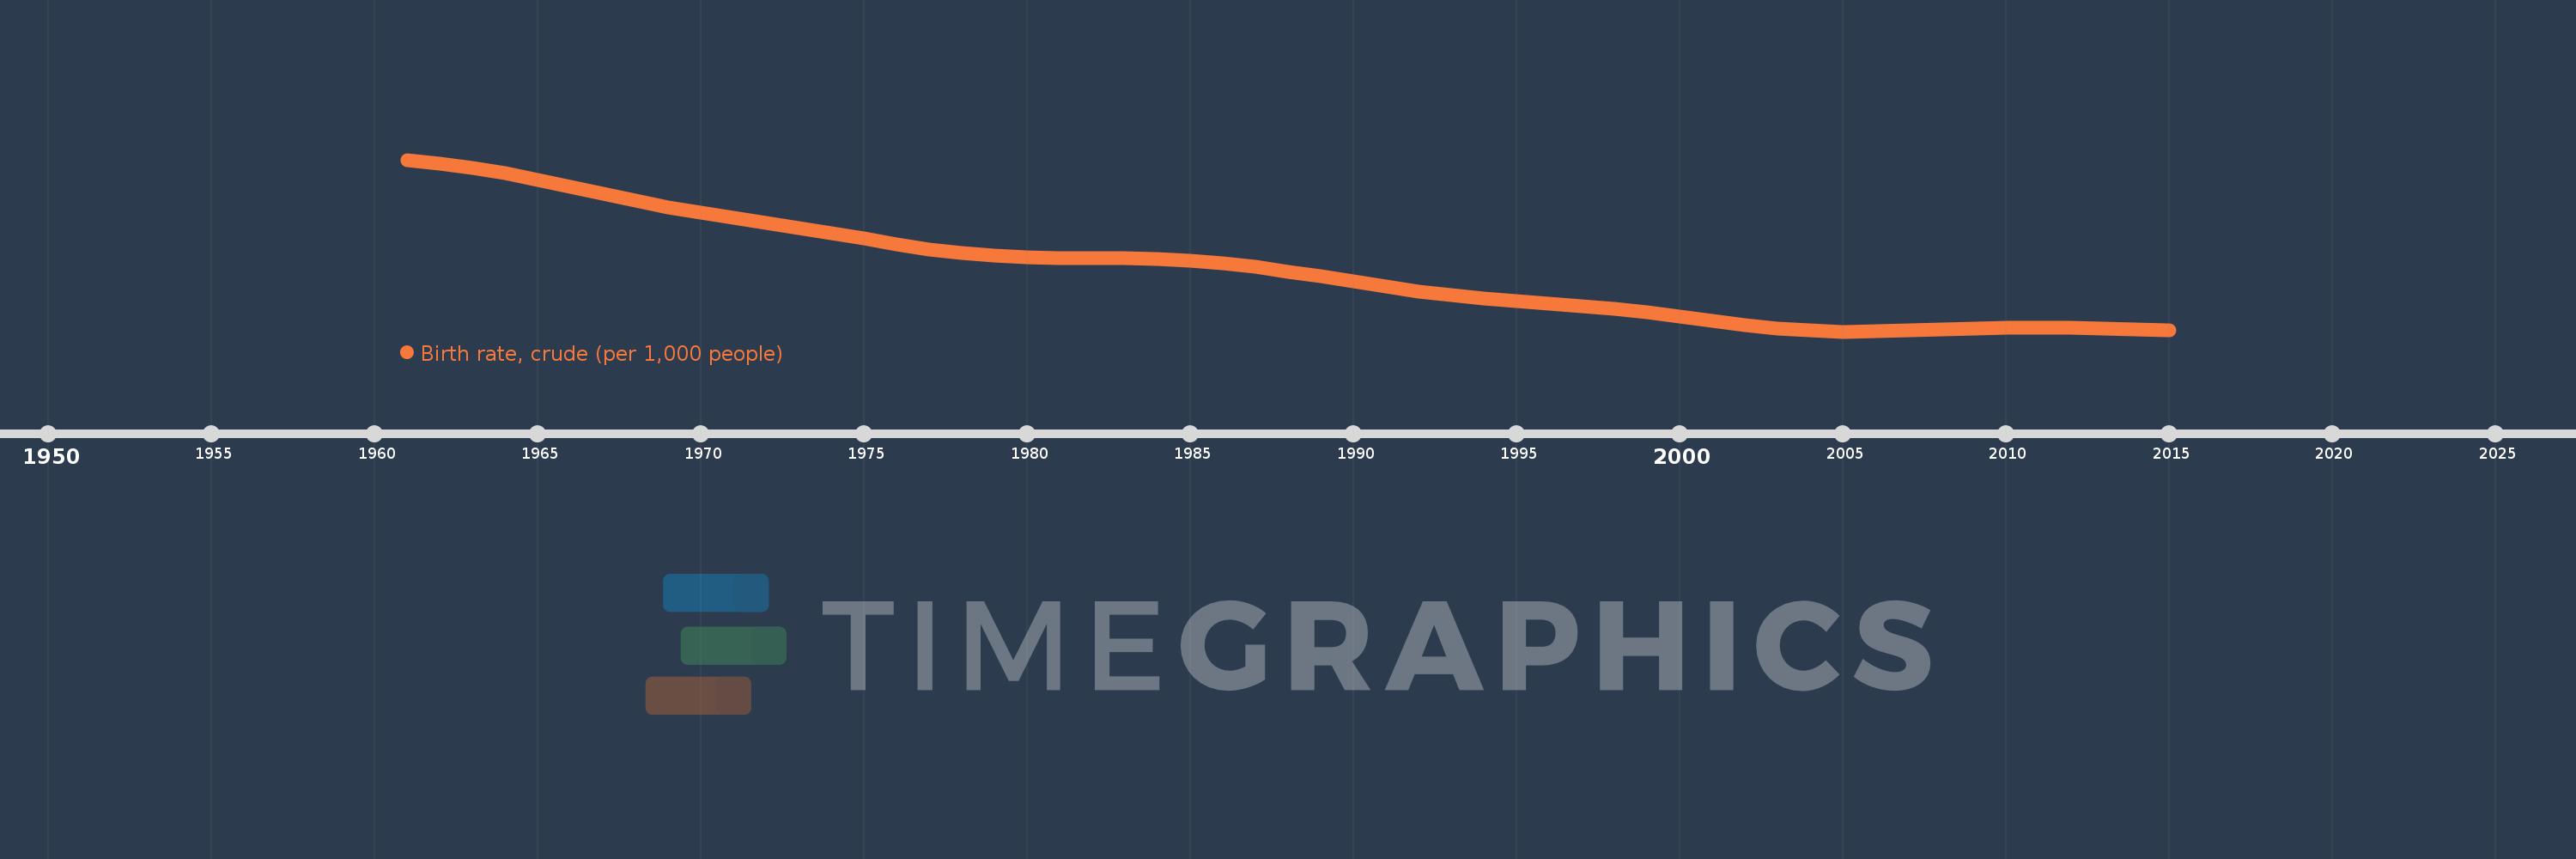
Birth rate, crude (per 1,000 people)
2015,2014,2013,2012,2011,2010,2009,2008,2007,2006,2005,2004,2003,2002,2001,2000,1999,1998,1997,1996,1995,1994,1993,1992,1991,1990,1989,1988,1987,1986,1985,1984,1983,1982,1981,1980,1979,1978,1977,1976,1975,1974,1973,1972,1971,1970,1969,1968,1967,1966,1965,1964,1963,1962,1961
Estas estatísticas em outros países:
AfghanistanAlbaniaAlgeriaAmerican SamoaAndorraAngolaAntigua and BarbudaArab WorldArgentinaArmeniaArubaAustraliaAustriaAzerbaijanBahamas, TheBahrainBangladeshBarbadosBelarusBelgiumBelizeBeninBermudaBhutanBoliviaBosnia and HerzegovinaBotswanaBrazilBrunei DarussalamBulgariaBurkina FasoBurundiCabo VerdeCambodiaCameroonCanadaCaribbean small statesCayman IslandsCentral African RepublicCentral Europe and the BalticsChadChannel IslandsChileChinaColombiaComorosCongo, Dem. Rep.Congo, Rep.Costa RicaCote d'IvoireCroatiaCubaCuracaoCyprusCzech RepublicDenmarkDjiboutiDominicaDominican RepublicEarly-demographic dividendEast Asia & PacificEast Asia & Pacific (excluding high income)East Asia & Pacific (IDA & IBRD countries)EcuadorEgypt, Arab Rep.El SalvadorEquatorial GuineaEritreaEstoniaEthiopiaEuro areaEurope & Central AsiaEurope & Central Asia (excluding high income)Europe & Central Asia (IDA & IBRD countries)European UnionFaroe IslandsFijiFinlandFragile and conflict affected situationsFranceFrench PolynesiaGabonGambia, TheGeorgiaGermanyGhanaGreeceGreenlandGrenadaGuamGuatemalaGuineaGuinea-BissauGuyanaHaitiHeavily indebted poor countries (HIPC)High incomeHondurasHong Kong SAR, ChinaHungaryIBRD onlyIcelandIDA & IBRD totalIDA blendIDA onlyIDA totalIndiaIndonesiaIran, Islamic Rep.IraqIrelandIsle of ManIsraelItalyJamaicaJapanJordanKazakhstanKenyaKiribatiKorea, Dem. People’s Rep.Korea, Rep.KosovoKuwaitKyrgyz RepublicLao PDRLate-demographic dividendLatin America & Caribbean Latin America & Caribbean (excluding high income)Latin America & the Caribbean (IDA & IBRD countries)LatviaLeast developed countries: UN classificationLebanonLesothoLiberiaLibyaLiechtensteinLithuaniaLow & middle incomeLow incomeLower middle incomeLuxembourgMacao SAR, ChinaMacedonia, FYRMadagascarMalawiMalaysiaMaldivesMaliMaltaMarshall IslandsMauritaniaMauritiusMexicoMicronesia, Fed. Sts.Middle East & North AfricaMiddle East & North Africa (excluding high income)Middle East & North Africa (IDA & IBRD countries)Middle incomeMoldovaMonacoMongoliaMontenegroMoroccoMozambiqueMyanmarNamibiaNepalNetherlandsNew CaledoniaNew ZealandNicaraguaNigerNigeriaNorth AmericaNorwayOECD membersOmanOther small statesPacific island small statesPakistanPalauPanamaPapua New GuineaParaguayPeruPhilippinesPolandPortugalPost-demographic dividendPre-demographic dividendPuerto RicoQatarRomaniaRussian FederationRwandaSamoaSan MarinoSao Tome and PrincipeSaudi ArabiaSenegalSerbiaSeychellesSierra LeoneSingaporeSint Maarten (Dutch part)Slovak RepublicSloveniaSmall statesSolomon IslandsSomaliaSouth AfricaSouth AsiaSouth Asia (IDA & IBRD)South SudanSpainSri LankaSt. Kitts and NevisSt. LuciaSt. Martin (French part)St. Vincent and the GrenadinesSub-Saharan Africa Sub-Saharan Africa (excluding high income)Sub-Saharan Africa (IDA & IBRD countries)SudanSurinameSwazilandSwedenSwitzerlandSyrian Arab RepublicTajikistanTanzaniaThailandTimor-LesteTogoTongaTrinidad and TobagoTunisiaTurkeyTurkmenistanUgandaUkraineUnited Arab EmiratesUnited KingdomUnited StatesUpper middle incomeUruguayUzbekistanVanuatuVenezuela, RBVietnamVirgin Islands (U.S.)West Bank and GazaWorldYemen, Rep.ZambiaZimbabwe Linha do tempo:
Nesta escala de tempo está apresentado um gráfico de 1961 ano até 2015 ano Bosnia and Herzegovina. Dados de 1960 ano ausente. O número de observações reais por data: 55.
Fonte (nome):
Indicadores de desenvolvimento mundial
Fonte (organização):
(1) United Nations Population Division. World Population Prospects, (2) Census reports and other statistical publications from national statistical offices, (3) Eurostat: Demographic Statistics, (4) United Nations Statistical Division. Population and Vital Statistics Reprot (various years), (5) U.S. Census Bureau: International Database, and (6) Secretariat of the Pacific Community: Statistics and Demography Programme.
Categorias:
Health
Foi atualizado:
23 abr 2017 ano
Indicadores de alterações dos valores ao longo dos anos
Mínimo:
8.772
1 jan 2005 ano
Máximo:
31.333
1 jan 1961 ano
Na data de observação
Valor
Mudança absoluta
A alteração em relação ao valor anterior
1 jan 1961 ano
31.333
+31.333
0.0%
1 jan 1962 ano
30.836
-0.497
-1.59%
1 jan 1963 ano
30.252
-0.584
-1.89%
1 jan 1964 ano
29.549
-0.703
-2.32%
1 jan 1965 ano
28.723
-0.826
-2.8%
1 jan 1966 ano
27.806
-0.917
-3.19%
1 jan 1967 ano
26.855
-0.951
-3.42%
1 jan 1968 ano
25.94
-0.915
-3.41%
1 jan 1969 ano
25.109
-0.831
-3.2%
1 jan 1970 ano
24.375
-0.734
-2.92%
1 jan 1971 ano
23.714
-0.661
-2.71%
1 jan 1972 ano
23.079
-0.635
-2.68%
1 jan 1973 ano
22.42
-0.659
-2.86%
1 jan 1974 ano
21.714
-0.706
-3.15%
1 jan 1975 ano
20.971
-0.743
-3.42%
1 jan 1976 ano
20.24
-0.731
-3.49%
1 jan 1977 ano
19.59
-0.65
-3.21%
1 jan 1978 ano
19.077
-0.513
-2.62%
1 jan 1979 ano
18.729
-0.348
-1.82%
1 jan 1980 ano
18.537
-0.192
-1.03%
1 jan 1981 ano
18.464
-0.073
-0.39%
1 jan 1982 ano
18.45
-0.014
-0.08%
1 jan 1983 ano
18.418
-0.032
-0.17%
1 jan 1984 ano
18.307
-0.111
-0.6%
1 jan 1985 ano
18.084
-0.223
-1.22%
1 jan 1986 ano
17.728
-0.356
-1.97%
1 jan 1987 ano
17.235
-0.493
-2.78%
1 jan 1988 ano
16.644
-0.591
-3.43%
1 jan 1989 ano
15.997
-0.647
-3.89%
1 jan 1990 ano
15.323
-0.674
-4.21%
1 jan 1991 ano
14.664
-0.659
-4.3%
1 jan 1992 ano
14.066
-0.598
-4.08%
1 jan 1993 ano
13.549
-0.517
-3.68%
1 jan 1994 ano
13.122
-0.427
-3.15%
1 jan 1995 ano
12.776
-0.346
-2.64%
1 jan 1996 ano
12.474
-0.302
-2.36%
1 jan 1997 ano
12.154
-0.32
-2.57%
1 jan 1998 ano
11.769
-0.385
-3.17%
1 jan 1999 ano
11.297
-0.472
-4.01%
1 jan 2000 ano
10.748
-0.549
-4.86%
1 jan 2001 ano
10.168
-0.58
-5.4%
1 jan 2002 ano
9.627
-0.541
-5.32%
1 jan 2003 ano
9.191
-0.436
-4.53%
1 jan 2004 ano
8.903
-0.288
-3.13%
1 jan 2005 ano
8.772
-0.131
-1.47%
1 jan 2006 ano
8.781
+0.009
0.1%
1 jan 2007 ano
8.891
+0.11
1.25%
1 jan 2008 ano
9.036
+0.145
1.63%
1 jan 2009 ano
9.164
+0.128
1.42%
1 jan 2010 ano
9.248
+0.084
0.92%
1 jan 2011 ano
9.272
+0.024
0.26%
1 jan 2012 ano
9.235
-0.037
-0.4%
1 jan 2013 ano
9.159
-0.076
-0.82%
1 jan 2014 ano
9.062
-0.097
-1.06%
1 jan 2015 ano
8.947
-0.115
-1.27%
Classificação de países por estatísticas atuais por anos


Comentários: