29
/pt/
pt
AIzaSyAYiBZKx7MnpbEhh9jyipgxe19OcubqV5w
April 1, 2024
111919
Costa Rica
CRI
true
2
1
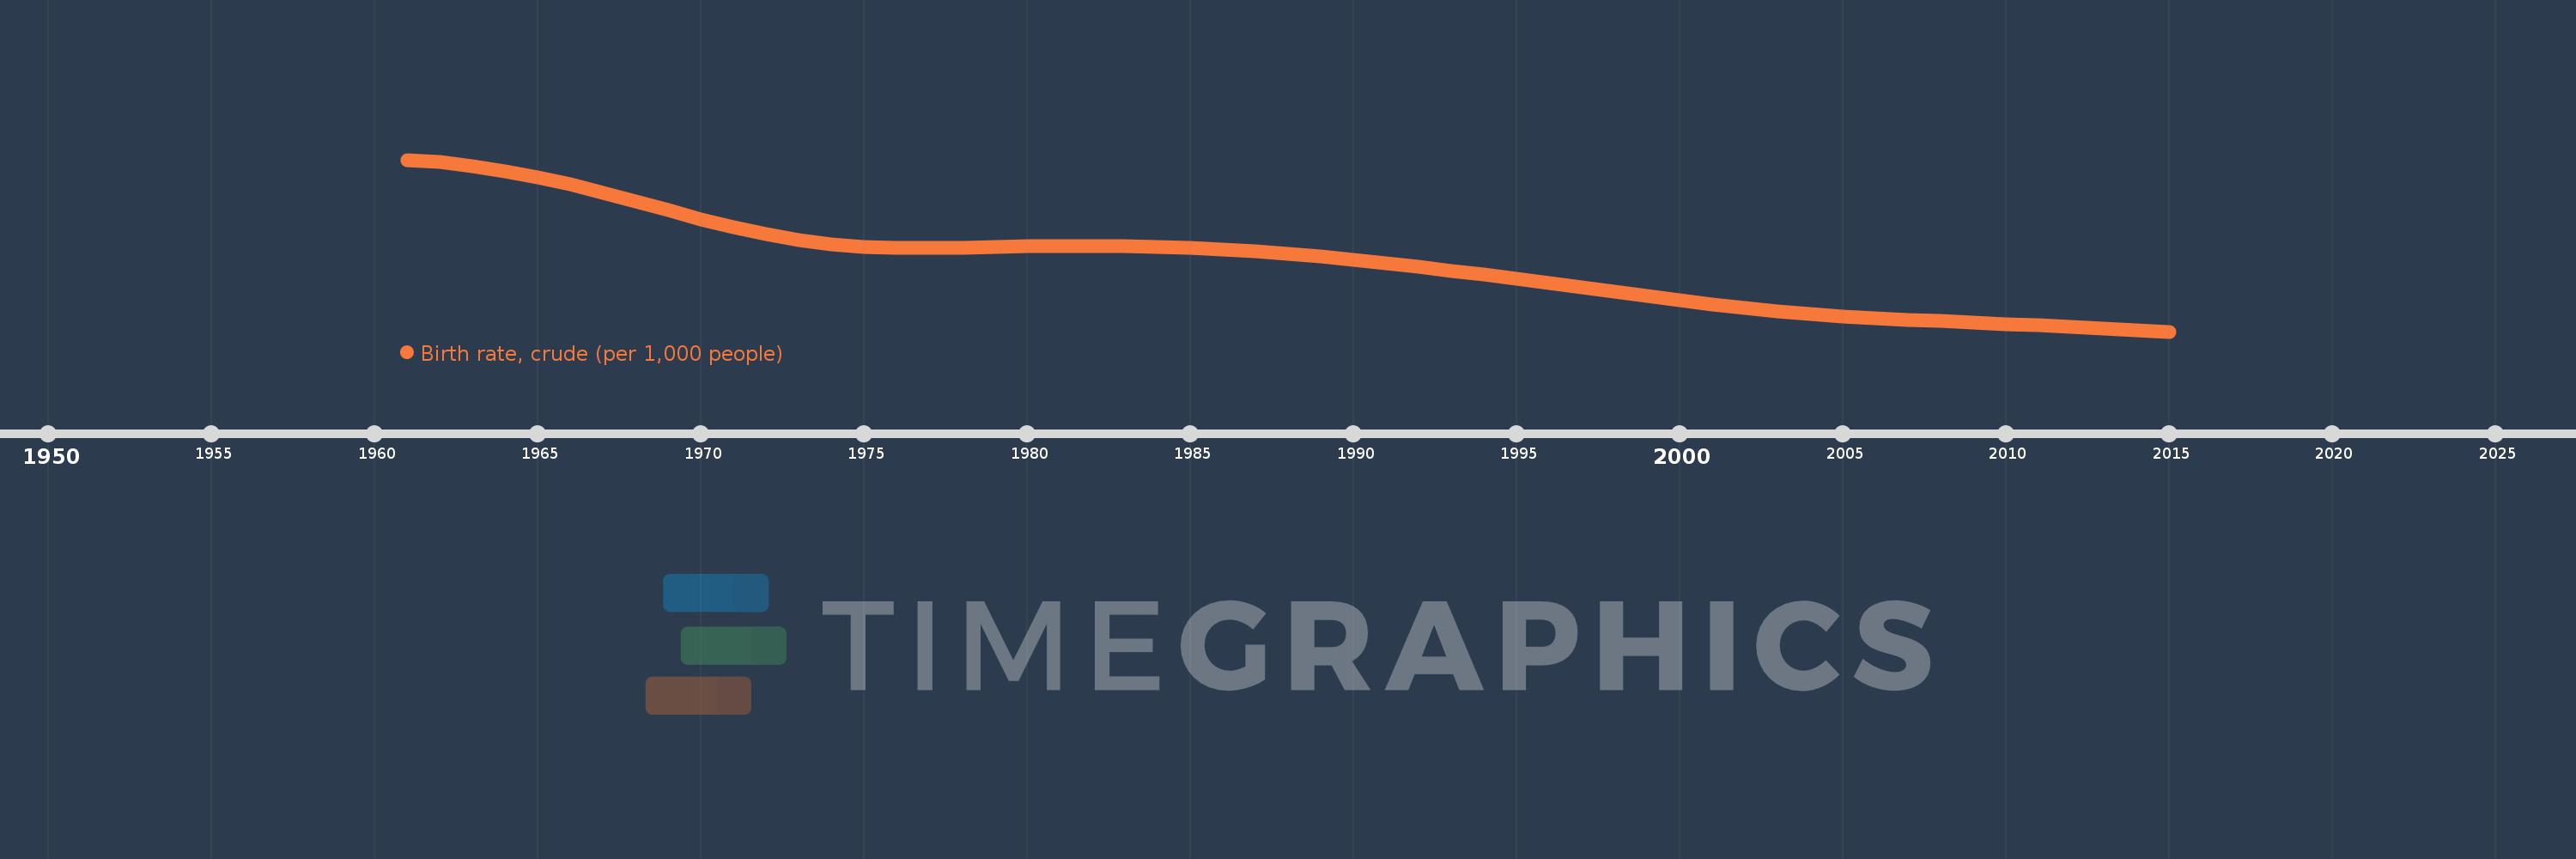
Birth rate, crude (per 1,000 people)
2015,2014,2013,2012,2011,2010,2009,2008,2007,2006,2005,2004,2003,2002,2001,2000,1999,1998,1997,1996,1995,1994,1993,1992,1991,1990,1989,1988,1987,1986,1985,1984,1983,1982,1981,1980,1979,1978,1977,1976,1975,1974,1973,1972,1971,1970,1969,1968,1967,1966,1965,1964,1963,1962,1961
Estas estatísticas em outros países:
AfghanistanAlbaniaAlgeriaAmerican SamoaAndorraAngolaAntigua and BarbudaArab WorldArgentinaArmeniaArubaAustraliaAustriaAzerbaijanBahamas, TheBahrainBangladeshBarbadosBelarusBelgiumBelizeBeninBermudaBhutanBoliviaBosnia and HerzegovinaBotswanaBrazilBrunei DarussalamBulgariaBurkina FasoBurundiCabo VerdeCambodiaCameroonCanadaCaribbean small statesCayman IslandsCentral African RepublicCentral Europe and the BalticsChadChannel IslandsChileChinaColombiaComorosCongo, Dem. Rep.Congo, Rep.Costa RicaCote d'IvoireCroatiaCubaCuracaoCyprusCzech RepublicDenmarkDjiboutiDominicaDominican RepublicEarly-demographic dividendEast Asia & PacificEast Asia & Pacific (excluding high income)East Asia & Pacific (IDA & IBRD countries)EcuadorEgypt, Arab Rep.El SalvadorEquatorial GuineaEritreaEstoniaEthiopiaEuro areaEurope & Central AsiaEurope & Central Asia (excluding high income)Europe & Central Asia (IDA & IBRD countries)European UnionFaroe IslandsFijiFinlandFragile and conflict affected situationsFranceFrench PolynesiaGabonGambia, TheGeorgiaGermanyGhanaGreeceGreenlandGrenadaGuamGuatemalaGuineaGuinea-BissauGuyanaHaitiHeavily indebted poor countries (HIPC)High incomeHondurasHong Kong SAR, ChinaHungaryIBRD onlyIcelandIDA & IBRD totalIDA blendIDA onlyIDA totalIndiaIndonesiaIran, Islamic Rep.IraqIrelandIsle of ManIsraelItalyJamaicaJapanJordanKazakhstanKenyaKiribatiKorea, Dem. People’s Rep.Korea, Rep.KosovoKuwaitKyrgyz RepublicLao PDRLate-demographic dividendLatin America & Caribbean Latin America & Caribbean (excluding high income)Latin America & the Caribbean (IDA & IBRD countries)LatviaLeast developed countries: UN classificationLebanonLesothoLiberiaLibyaLiechtensteinLithuaniaLow & middle incomeLow incomeLower middle incomeLuxembourgMacao SAR, ChinaMacedonia, FYRMadagascarMalawiMalaysiaMaldivesMaliMaltaMarshall IslandsMauritaniaMauritiusMexicoMicronesia, Fed. Sts.Middle East & North AfricaMiddle East & North Africa (excluding high income)Middle East & North Africa (IDA & IBRD countries)Middle incomeMoldovaMonacoMongoliaMontenegroMoroccoMozambiqueMyanmarNamibiaNepalNetherlandsNew CaledoniaNew ZealandNicaraguaNigerNigeriaNorth AmericaNorwayOECD membersOmanOther small statesPacific island small statesPakistanPalauPanamaPapua New GuineaParaguayPeruPhilippinesPolandPortugalPost-demographic dividendPre-demographic dividendPuerto RicoQatarRomaniaRussian FederationRwandaSamoaSan MarinoSao Tome and PrincipeSaudi ArabiaSenegalSerbiaSeychellesSierra LeoneSingaporeSint Maarten (Dutch part)Slovak RepublicSloveniaSmall statesSolomon IslandsSomaliaSouth AfricaSouth AsiaSouth Asia (IDA & IBRD)South SudanSpainSri LankaSt. Kitts and NevisSt. LuciaSt. Martin (French part)St. Vincent and the GrenadinesSub-Saharan Africa Sub-Saharan Africa (excluding high income)Sub-Saharan Africa (IDA & IBRD countries)SudanSurinameSwazilandSwedenSwitzerlandSyrian Arab RepublicTajikistanTanzaniaThailandTimor-LesteTogoTongaTrinidad and TobagoTunisiaTurkeyTurkmenistanUgandaUkraineUnited Arab EmiratesUnited KingdomUnited StatesUpper middle incomeUruguayUzbekistanVanuatuVenezuela, RBVietnamVirgin Islands (U.S.)West Bank and GazaWorldYemen, Rep.ZambiaZimbabwe Linha do tempo:
Nesta escala de tempo está apresentado um gráfico de 1961 ano até 2015 ano Costa Rica. Dados de 1960 ano ausente. O número de observações reais por data: 55.
Fonte (nome):
Indicadores de desenvolvimento mundial
Fonte (organização):
(1) United Nations Population Division. World Population Prospects, (2) Census reports and other statistical publications from national statistical offices, (3) Eurostat: Demographic Statistics, (4) United Nations Statistical Division. Population and Vital Statistics Reprot (various years), (5) U.S. Census Bureau: International Database, and (6) Secretariat of the Pacific Community: Statistics and Demography Programme.
Categorias:
Health
Foi atualizado:
23 abr 2017 ano
Indicadores de alterações dos valores ao longo dos anos
Mínimo:
14.768
1 jan 2015 ano
Máximo:
44.558
1 jan 1961 ano
Na data de observação
Valor
Mudança absoluta
A alteração em relação ao valor anterior
1 jan 1961 ano
44.558
+44.558
0.0%
1 jan 1962 ano
44.125
-0.433
-0.97%
1 jan 1963 ano
43.469
-0.656
-1.49%
1 jan 1964 ano
42.597
-0.872
-2.01%
1 jan 1965 ano
41.53
-1.067
-2.5%
1 jan 1966 ano
40.284
-1.246
-3.0%
1 jan 1967 ano
38.874
-1.41
-3.5%
1 jan 1968 ano
37.352
-1.522
-3.92%
1 jan 1969 ano
35.787
-1.565
-4.19%
1 jan 1970 ano
34.25
-1.537
-4.29%
1 jan 1971 ano
32.832
-1.418
-4.14%
1 jan 1972 ano
31.621
-1.211
-3.69%
1 jan 1973 ano
30.653
-0.968
-3.06%
1 jan 1974 ano
29.942
-0.711
-2.32%
1 jan 1975 ano
29.491
-0.451
-1.51%
1 jan 1976 ano
29.28
-0.211
-0.72%
1 jan 1977 ano
29.263
-0.017
-0.06%
1 jan 1978 ano
29.357
+0.094
0.32%
1 jan 1979 ano
29.483
+0.126
0.43%
1 jan 1980 ano
29.593
+0.11
0.37%
1 jan 1981 ano
29.649
+0.056
0.19%
1 jan 1982 ano
29.637
-0.012
-0.04%
1 jan 1983 ano
29.565
-0.072
-0.24%
1 jan 1984 ano
29.441
-0.124
-0.42%
1 jan 1985 ano
29.252
-0.189
-0.64%
1 jan 1986 ano
28.988
-0.264
-0.9%
1 jan 1987 ano
28.644
-0.344
-1.19%
1 jan 1988 ano
28.226
-0.418
-1.46%
1 jan 1989 ano
27.744
-0.482
-1.71%
1 jan 1990 ano
27.204
-0.54
-1.95%
1 jan 1991 ano
26.615
-0.589
-2.17%
1 jan 1992 ano
25.984
-0.631
-2.37%
1 jan 1993 ano
25.322
-0.662
-2.55%
1 jan 1994 ano
24.64
-0.682
-2.69%
1 jan 1995 ano
23.947
-0.693
-2.81%
1 jan 1996 ano
23.24
-0.707
-2.95%
1 jan 1997 ano
22.512
-0.728
-3.13%
1 jan 1998 ano
21.761
-0.751
-3.34%
1 jan 1999 ano
20.995
-0.766
-3.52%
1 jan 2000 ano
20.231
-0.764
-3.64%
1 jan 2001 ano
19.499
-0.732
-3.62%
1 jan 2002 ano
18.831
-0.668
-3.43%
1 jan 2003 ano
18.247
-0.584
-3.1%
1 jan 2004 ano
17.759
-0.488
-2.67%
1 jan 2005 ano
17.366
-0.393
-2.21%
1 jan 2006 ano
17.054
-0.312
-1.8%
1 jan 2007 ano
16.801
-0.253
-1.48%
1 jan 2008 ano
16.574
-0.227
-1.35%
1 jan 2009 ano
16.345
-0.229
-1.38%
1 jan 2010 ano
16.102
-0.243
-1.49%
1 jan 2011 ano
15.84
-0.262
-1.63%
1 jan 2012 ano
15.564
-0.276
-1.74%
1 jan 2013 ano
15.287
-0.277
-1.78%
1 jan 2014 ano
15.022
-0.265
-1.73%
1 jan 2015 ano
14.768
-0.254
-1.69%
Classificação de países por estatísticas atuais por anos


Comentários: