29
/pt/
pt
AIzaSyAYiBZKx7MnpbEhh9jyipgxe19OcubqV5w
April 1, 2024
88080
Bolivia
BOL
true
2
1
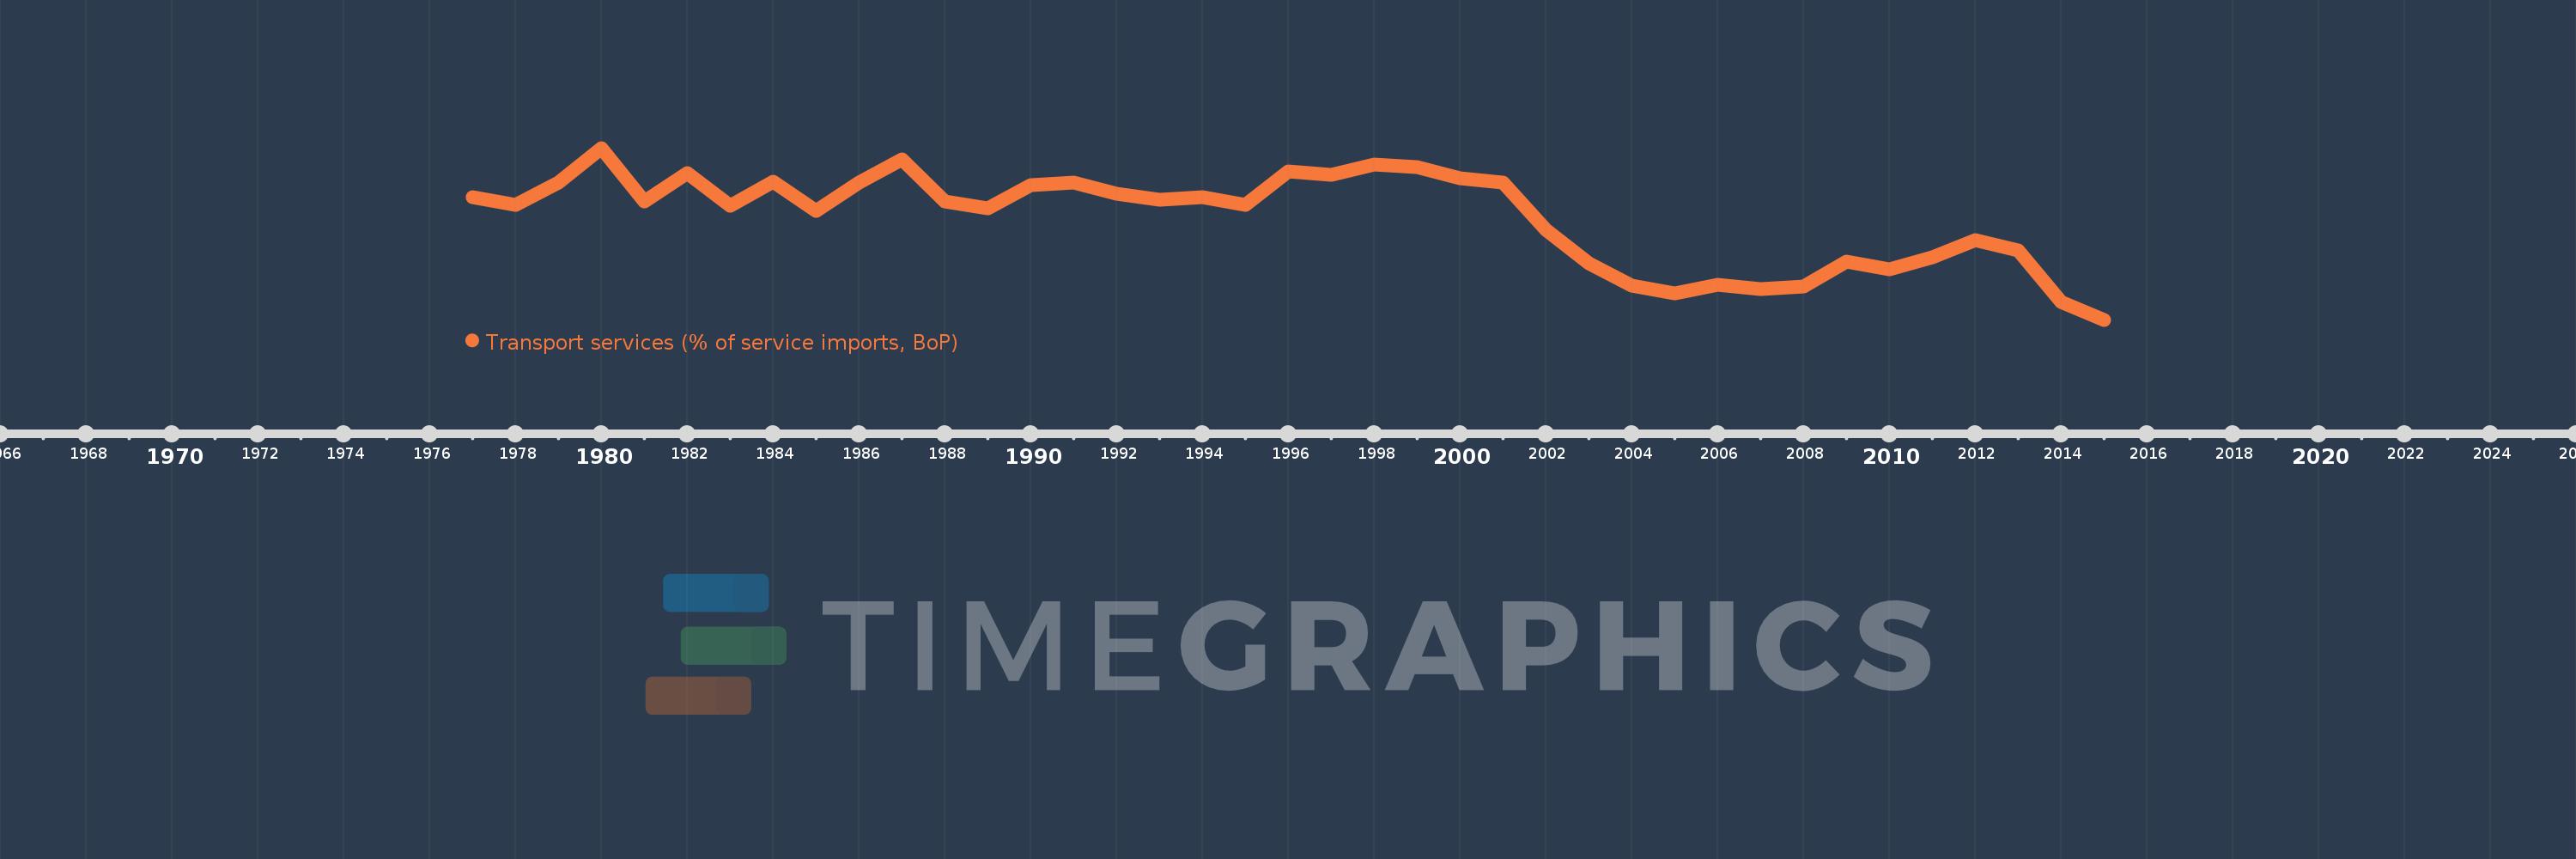
Transport services (% of service imports, BoP)
2015,2014,2013,2012,2011,2010,2009,2008,2007,2006,2005,2004,2003,2002,2001,2000,1999,1998,1997,1996,1995,1994,1993,1992,1991,1990,1989,1988,1987,1986,1985,1984,1983,1982,1981,1980,1979,1978,1977
Estas estatísticas em outros países:
AfghanistanAlbaniaAlgeriaAngolaAntigua and BarbudaArab WorldArgentinaArmeniaArubaAustraliaAustriaAzerbaijanBahamas, TheBahrainBangladeshBarbadosBelarusBelgiumBelizeBeninBermudaBhutanBoliviaBosnia and HerzegovinaBotswanaBrazilBrunei DarussalamBulgariaBurkina FasoBurundiCabo VerdeCambodiaCameroonCanadaCaribbean small statesCentral African RepublicCentral Europe and the BalticsChadChileChinaColombiaComorosCongo, Dem. Rep.Congo, Rep.Costa RicaCote d'IvoireCroatiaCuracaoCyprusCzech RepublicDenmarkDjiboutiDominicaDominican RepublicEarly-demographic dividendEast Asia & PacificEast Asia & Pacific (excluding high income)East Asia & Pacific (IDA & IBRD countries)EcuadorEgypt, Arab Rep.El SalvadorEquatorial GuineaEritreaEstoniaEthiopiaEuro areaEurope & Central AsiaEurope & Central Asia (excluding high income)Europe & Central Asia (IDA & IBRD countries)European UnionFaroe IslandsFijiFinlandFragile and conflict affected situationsFranceFrench PolynesiaGabonGambia, TheGeorgiaGermanyGhanaGreeceGrenadaGuatemalaGuineaGuinea-BissauGuyanaHaitiHeavily indebted poor countries (HIPC)High incomeHondurasHong Kong SAR, ChinaHungaryIBRD onlyIcelandIDA & IBRD totalIDA onlyIDA totalIndiaIndonesiaIran, Islamic Rep.IraqIrelandIsraelItalyJamaicaJapanJordanKazakhstanKenyaKiribatiKorea, Rep.KosovoKuwaitKyrgyz RepublicLao PDRLate-demographic dividendLatin America & Caribbean Latin America & Caribbean (excluding high income)Latin America & the Caribbean (IDA & IBRD countries)LatviaLeast developed countries: UN classificationLebanonLesothoLiberiaLibyaLithuaniaLow & middle incomeLow incomeLower middle incomeLuxembourgMacao SAR, ChinaMacedonia, FYRMadagascarMalawiMalaysiaMaldivesMaliMaltaMarshall IslandsMauritaniaMauritiusMexicoMicronesia, Fed. Sts.Middle East & North AfricaMiddle East & North Africa (excluding high income)Middle East & North Africa (IDA & IBRD countries)Middle incomeMoldovaMongoliaMontenegroMoroccoMozambiqueMyanmarNamibiaNepalNetherlandsNew CaledoniaNew ZealandNicaraguaNigerNigeriaNorth AmericaNorwayOECD membersOmanOther small statesPacific island small statesPakistanPalauPanamaPapua New GuineaParaguayPeruPhilippinesPolandPortugalPost-demographic dividendPre-demographic dividendQatarRomaniaRussian FederationRwandaSamoaSao Tome and PrincipeSaudi ArabiaSenegalSerbiaSeychellesSierra LeoneSingaporeSint Maarten (Dutch part)Slovak RepublicSloveniaSmall statesSolomon IslandsSouth AfricaSouth AsiaSouth Asia (IDA & IBRD)South SudanSpainSri LankaSt. Kitts and NevisSt. LuciaSt. Vincent and the GrenadinesSub-Saharan Africa Sub-Saharan Africa (excluding high income)Sub-Saharan Africa (IDA & IBRD countries)SudanSurinameSwazilandSwedenSwitzerlandSyrian Arab RepublicTajikistanTanzaniaThailandTimor-LesteTogoTongaTrinidad and TobagoTunisiaTurkeyTuvaluUgandaUkraineUnited KingdomUnited StatesUpper middle incomeUruguayVanuatuVenezuela, RBWest Bank and GazaWorldYemen, Rep.ZambiaZimbabwe Linha do tempo:
Nesta escala de tempo está apresentado um gráfico de 1977 ano até 2015 ano Bolivia. Dados de 1976 ano ausente. O número de observações reais por data: 39.
Fonte (nome):
Indicadores de desenvolvimento mundial
Fonte (organização):
International Monetary Fund, Balance of Payments Statistics Yearbook and data files.
Categorias:
Economy & Growth, Trade
Foi atualizado:
23 abr 2017 ano
Indicadores de alterações dos valores ao longo dos anos
Mínimo:
26.284
1 jan 2015 ano
Máximo:
65.707
1 jan 1980 ano
Na data de observação
Valor
Mudança absoluta
A alteração em relação ao valor anterior
1 jan 1977 ano
54.385
+54.385
0.0%
1 jan 1978 ano
52.611
-1.773
-3.26%
1 jan 1979 ano
57.806
+5.194
9.87%
1 jan 1980 ano
65.707
+7.901
13.67%
1 jan 1981 ano
53.346
-12.361
-18.81%
1 jan 1982 ano
60.006
+6.66
12.48%
1 jan 1983 ano
52.503
-7.503
-12.5%
1 jan 1984 ano
57.931
+5.428
10.34%
1 jan 1985 ano
51.282
-6.649
-11.48%
1 jan 1986 ano
57.7
+6.418
12.52%
1 jan 1987 ano
63.141
+5.441
9.43%
1 jan 1988 ano
53.442
-9.699
-15.36%
1 jan 1989 ano
51.884
-1.558
-2.92%
1 jan 1990 ano
57.076
+5.192
10.01%
1 jan 1991 ano
57.759
+0.683
1.2%
1 jan 1992 ano
55.27
-2.489
-4.31%
1 jan 1993 ano
53.73
-1.54
-2.79%
1 jan 1994 ano
54.367
+0.638
1.19%
1 jan 1995 ano
52.681
-1.686
-3.1%
1 jan 1996 ano
60.308
+7.627
14.48%
1 jan 1997 ano
59.578
-0.73
-1.21%
1 jan 1998 ano
61.862
+2.283
3.83%
1 jan 1999 ano
61.226
-0.636
-1.03%
1 jan 2000 ano
58.661
-2.565
-4.19%
1 jan 2001 ano
57.749
-0.912
-1.56%
1 jan 2002 ano
46.826
-10.923
-18.91%
1 jan 2003 ano
39.201
-7.625
-16.28%
1 jan 2004 ano
34.121
-5.08
-12.96%
1 jan 2005 ano
32.328
-1.793
-5.26%
1 jan 2006 ano
34.323
+1.995
6.17%
1 jan 2007 ano
33.264
-1.058
-3.08%
1 jan 2008 ano
33.86
+0.596
1.79%
1 jan 2009 ano
39.534
+5.673
16.75%
1 jan 2010 ano
37.857
-1.676
-4.24%
1 jan 2011 ano
40.596
+2.738
7.23%
1 jan 2012 ano
44.533
+3.937
9.7%
1 jan 2013 ano
42.252
-2.281
-5.12%
1 jan 2014 ano
30.346
-11.906
-28.18%
1 jan 2015 ano
26.284
-4.061
-13.38%
Classificação de países por estatísticas atuais por anos


Comentários: