29
/pt/
pt
AIzaSyAYiBZKx7MnpbEhh9jyipgxe19OcubqV5w
April 1, 2024
265391
Togo
TGO
true
2
1
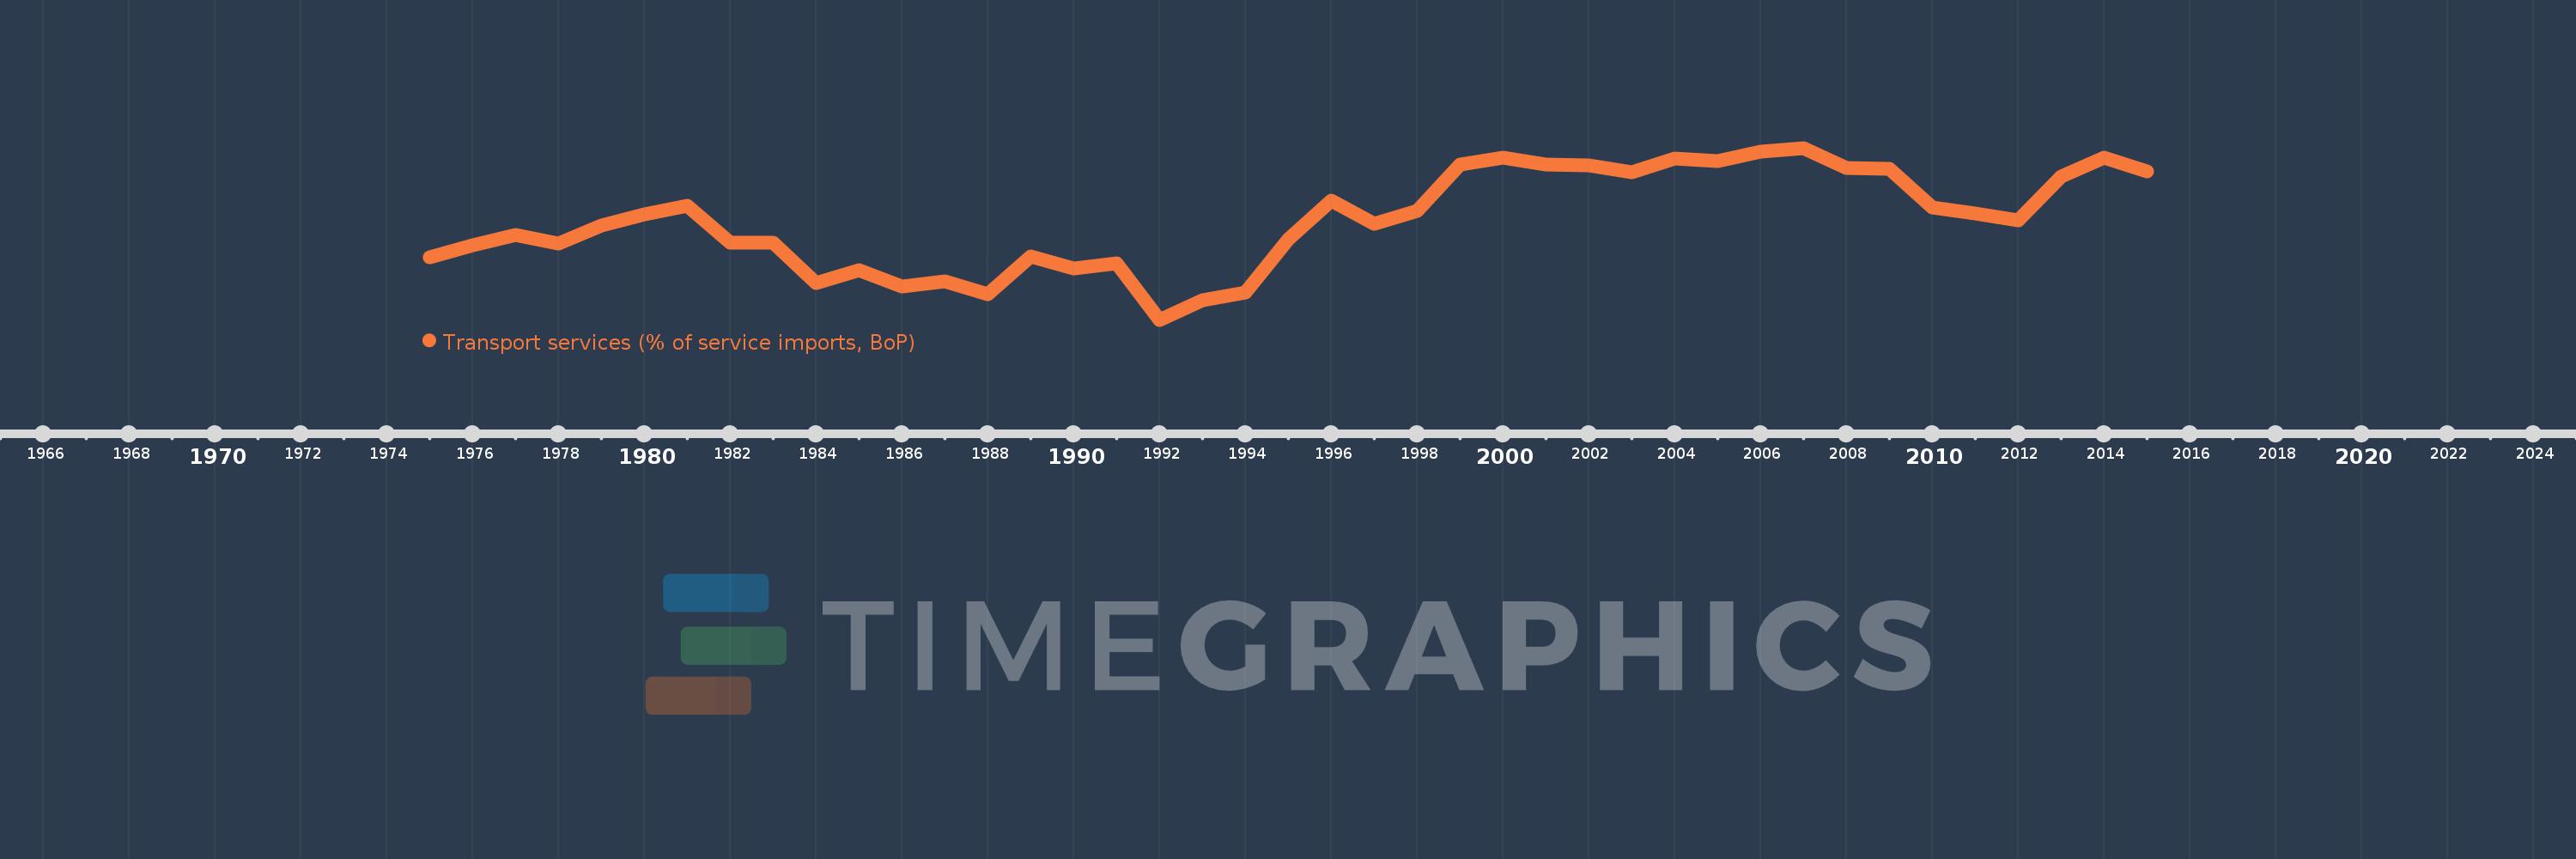
Transport services (% of service imports, BoP)
2015,2014,2013,2012,2011,2010,2009,2008,2007,2006,2005,2004,2003,2002,2001,2000,1999,1998,1997,1996,1995,1994,1993,1992,1991,1990,1989,1988,1987,1986,1985,1984,1983,1982,1981,1980,1979,1978,1977,1976,1975
Estas estatísticas em outros países:
AfghanistanAlbaniaAlgeriaAngolaAntigua and BarbudaArab WorldArgentinaArmeniaArubaAustraliaAustriaAzerbaijanBahamas, TheBahrainBangladeshBarbadosBelarusBelgiumBelizeBeninBermudaBhutanBoliviaBosnia and HerzegovinaBotswanaBrazilBrunei DarussalamBulgariaBurkina FasoBurundiCabo VerdeCambodiaCameroonCanadaCaribbean small statesCentral African RepublicCentral Europe and the BalticsChadChileChinaColombiaComorosCongo, Dem. Rep.Congo, Rep.Costa RicaCote d'IvoireCroatiaCuracaoCyprusCzech RepublicDenmarkDjiboutiDominicaDominican RepublicEarly-demographic dividendEast Asia & PacificEast Asia & Pacific (excluding high income)East Asia & Pacific (IDA & IBRD countries)EcuadorEgypt, Arab Rep.El SalvadorEquatorial GuineaEritreaEstoniaEthiopiaEuro areaEurope & Central AsiaEurope & Central Asia (excluding high income)Europe & Central Asia (IDA & IBRD countries)European UnionFaroe IslandsFijiFinlandFragile and conflict affected situationsFranceFrench PolynesiaGabonGambia, TheGeorgiaGermanyGhanaGreeceGrenadaGuatemalaGuineaGuinea-BissauGuyanaHaitiHeavily indebted poor countries (HIPC)High incomeHondurasHong Kong SAR, ChinaHungaryIBRD onlyIcelandIDA & IBRD totalIDA onlyIDA totalIndiaIndonesiaIran, Islamic Rep.IraqIrelandIsraelItalyJamaicaJapanJordanKazakhstanKenyaKiribatiKorea, Rep.KosovoKuwaitKyrgyz RepublicLao PDRLate-demographic dividendLatin America & Caribbean Latin America & Caribbean (excluding high income)Latin America & the Caribbean (IDA & IBRD countries)LatviaLeast developed countries: UN classificationLebanonLesothoLiberiaLibyaLithuaniaLow & middle incomeLow incomeLower middle incomeLuxembourgMacao SAR, ChinaMacedonia, FYRMadagascarMalawiMalaysiaMaldivesMaliMaltaMarshall IslandsMauritaniaMauritiusMexicoMicronesia, Fed. Sts.Middle East & North AfricaMiddle East & North Africa (excluding high income)Middle East & North Africa (IDA & IBRD countries)Middle incomeMoldovaMongoliaMontenegroMoroccoMozambiqueMyanmarNamibiaNepalNetherlandsNew CaledoniaNew ZealandNicaraguaNigerNigeriaNorth AmericaNorwayOECD membersOmanOther small statesPacific island small statesPakistanPalauPanamaPapua New GuineaParaguayPeruPhilippinesPolandPortugalPost-demographic dividendPre-demographic dividendQatarRomaniaRussian FederationRwandaSamoaSao Tome and PrincipeSaudi ArabiaSenegalSerbiaSeychellesSierra LeoneSingaporeSint Maarten (Dutch part)Slovak RepublicSloveniaSmall statesSolomon IslandsSouth AfricaSouth AsiaSouth Asia (IDA & IBRD)South SudanSpainSri LankaSt. Kitts and NevisSt. LuciaSt. Vincent and the GrenadinesSub-Saharan Africa Sub-Saharan Africa (excluding high income)Sub-Saharan Africa (IDA & IBRD countries)SudanSurinameSwazilandSwedenSwitzerlandSyrian Arab RepublicTajikistanTanzaniaThailandTimor-LesteTogoTongaTrinidad and TobagoTunisiaTurkeyTuvaluUgandaUkraineUnited KingdomUnited StatesUpper middle incomeUruguayVanuatuVenezuela, RBWest Bank and GazaWorldYemen, Rep.ZambiaZimbabwe Linha do tempo:
Nesta escala de tempo está apresentado um gráfico de 1975 ano até 2015 ano Togo. Dados de 1974 ano ausente. O número de observações reais por data: 41.
Fonte (nome):
Indicadores de desenvolvimento mundial
Fonte (organização):
International Monetary Fund, Balance of Payments Statistics Yearbook and data files.
Categorias:
Economy & Growth, Trade
Foi atualizado:
23 abr 2017 ano
Indicadores de alterações dos valores ao longo dos anos
Mínimo:
38.532
1 jan 1992 ano
Máximo:
74.91
1 jan 2007 ano
Na data de observação
Valor
Mudança absoluta
A alteração em relação ao valor anterior
1 jan 1975 ano
51.695
+51.695
0.0%
1 jan 1976 ano
54.23
+2.535
4.9%
1 jan 1977 ano
56.457
+2.227
4.11%
1 jan 1978 ano
54.713
-1.744
-3.09%
1 jan 1979 ano
58.461
+3.747
6.85%
1 jan 1980 ano
60.851
+2.39
4.09%
1 jan 1981 ano
62.662
+1.811
2.98%
1 jan 1982 ano
54.838
-7.824
-12.49%
1 jan 1983 ano
54.898
+0.06
0.11%
1 jan 1984 ano
46.38
-8.518
-15.52%
1 jan 1985 ano
48.971
+2.591
5.59%
1 jan 1986 ano
45.604
-3.367
-6.87%
1 jan 1987 ano
46.661
+1.057
2.32%
1 jan 1988 ano
43.917
-2.744
-5.88%
1 jan 1989 ano
51.983
+8.067
18.37%
1 jan 1990 ano
49.354
-2.629
-5.06%
1 jan 1991 ano
50.53
+1.176
2.38%
1 jan 1992 ano
38.532
-11.999
-23.75%
1 jan 1993 ano
42.729
+4.197
10.89%
1 jan 1994 ano
44.351
+1.623
3.8%
1 jan 1995 ano
55.615
+11.264
25.4%
1 jan 1996 ano
63.811
+8.195
14.74%
1 jan 1997 ano
58.877
-4.934
-7.73%
1 jan 1998 ano
61.597
+2.72
4.62%
1 jan 1999 ano
71.363
+9.766
15.86%
1 jan 2000 ano
72.923
+1.56
2.19%
1 jan 2001 ano
71.41
-1.513
-2.07%
1 jan 2002 ano
71.127
-0.284
-0.4%
1 jan 2003 ano
69.679
-1.448
-2.04%
1 jan 2004 ano
72.698
+3.019
4.33%
1 jan 2005 ano
72.083
-0.615
-0.85%
1 jan 2006 ano
74.099
+2.016
2.8%
1 jan 2007 ano
74.91
+0.811
1.09%
1 jan 2008 ano
70.653
-4.256
-5.68%
1 jan 2009 ano
70.431
-0.222
-0.31%
1 jan 2010 ano
62.23
-8.202
-11.65%
1 jan 2011 ano
60.973
-1.257
-2.02%
1 jan 2012 ano
59.592
-1.381
-2.27%
1 jan 2013 ano
68.862
+9.27
15.56%
1 jan 2014 ano
72.853
+3.991
5.79%
1 jan 2015 ano
69.976
-2.877
-3.95%
Classificação de países por estatísticas atuais por anos


Comentários: