30
/pt/
AIzaSyAYiBZKx7MnpbEhh9jyipgxe19OcubqV5w
April 1, 2024
85103
Bermuda
BMU
true
2
1
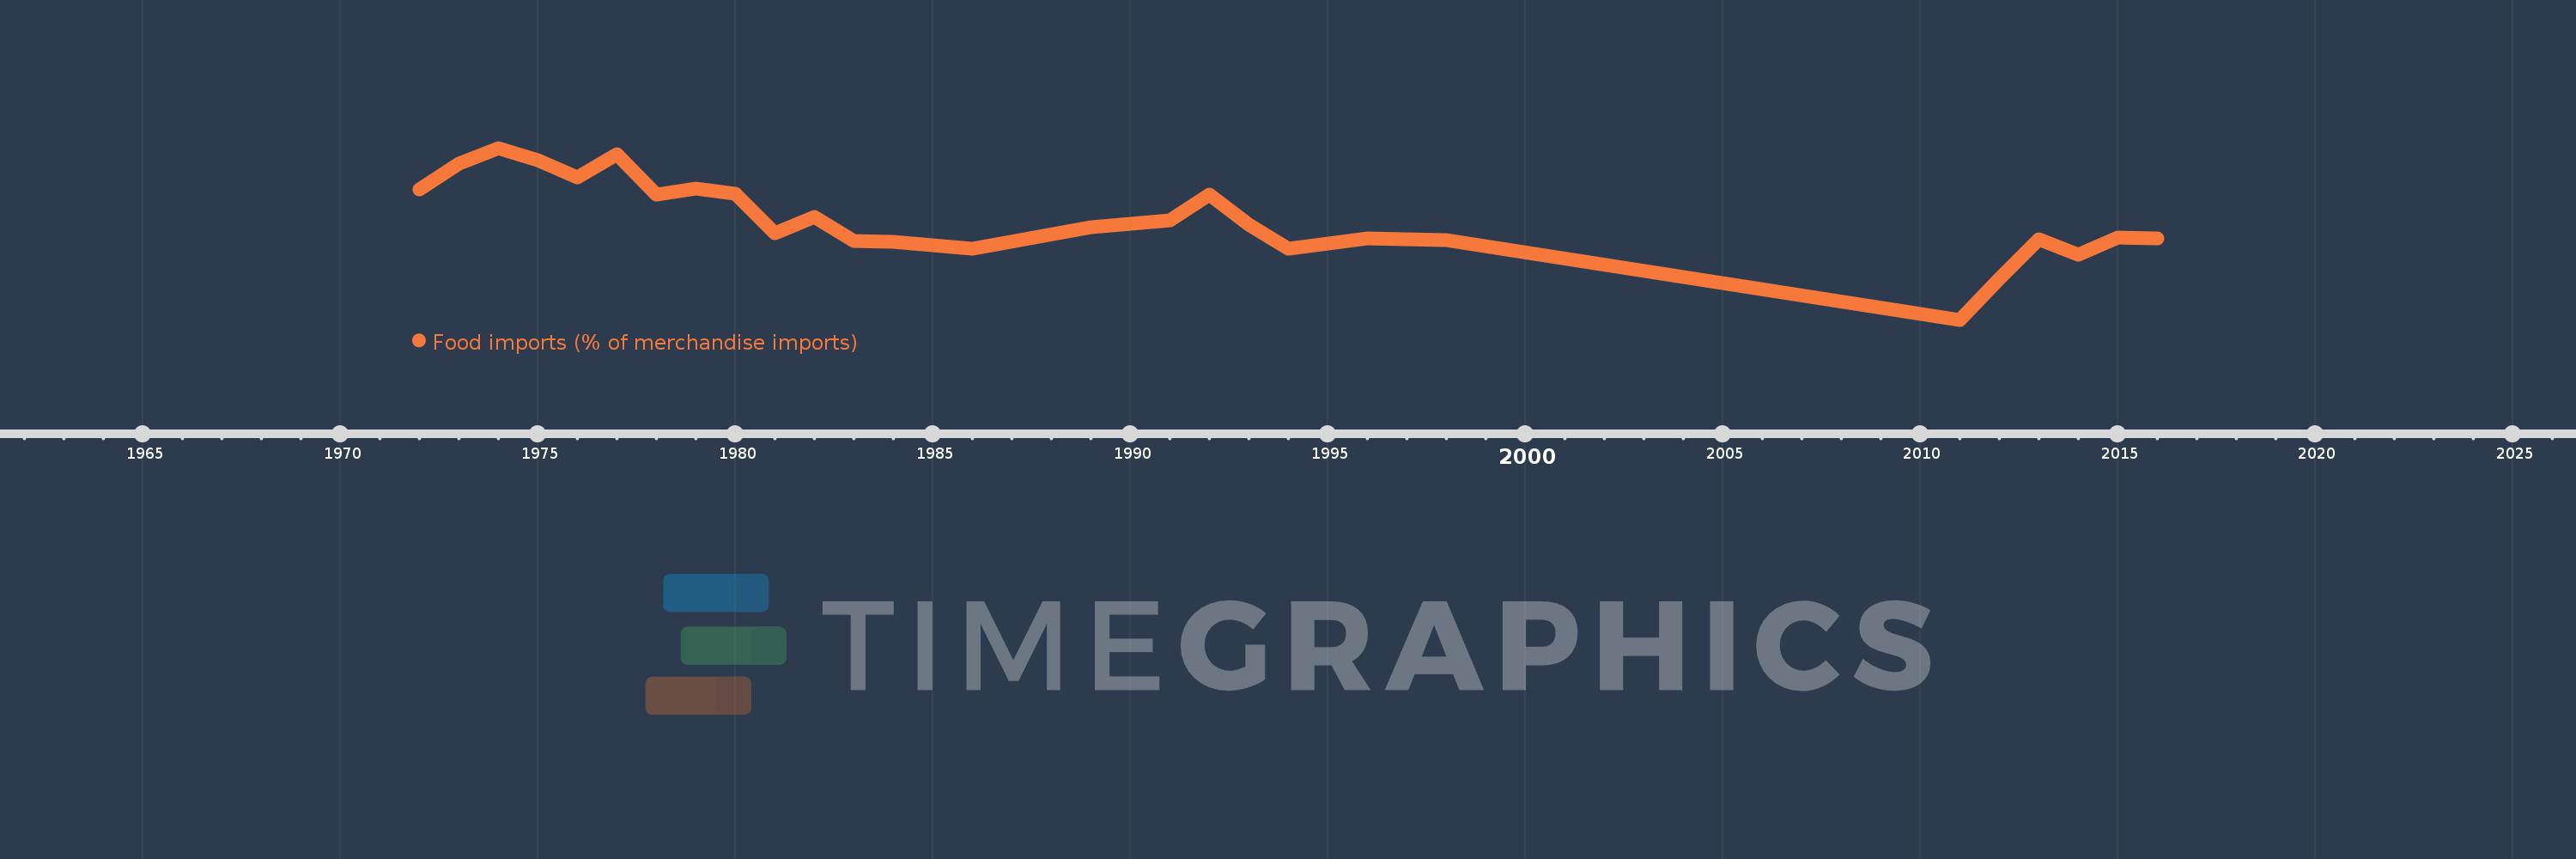
Food imports (% of merchandise imports)
2016,2015,2014,2013,2012,2011,1998,1996,1994,1993,1992,1991,1989,1986,1985,1984,1983,1982,1981,1980,1979,1978,1977,1976,1975,1974,1973,1972
