29
/pt/
pt
AIzaSyAYiBZKx7MnpbEhh9jyipgxe19OcubqV5w
April 1, 2024
223541
Philippines
PHL
true
2
1
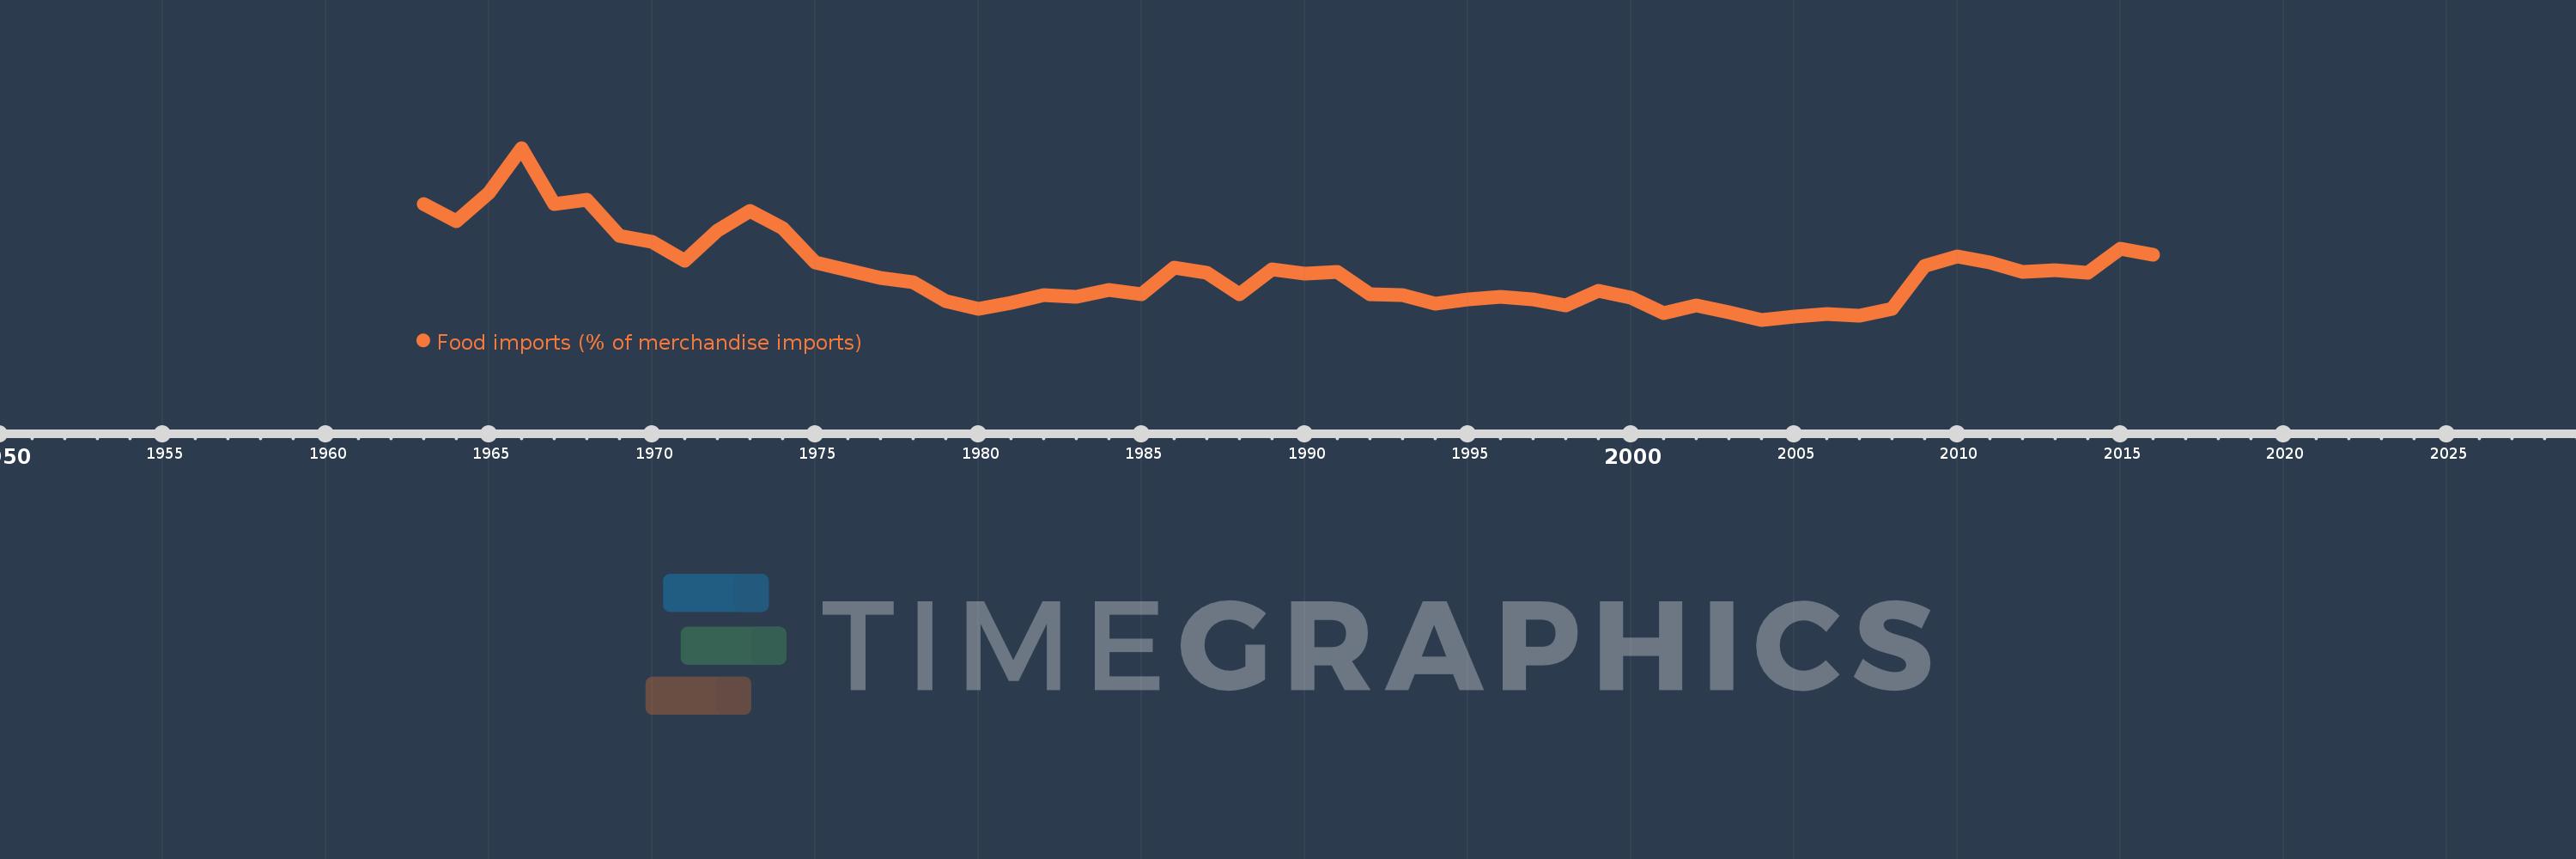
Food imports (% of merchandise imports)
2016,2015,2014,2013,2012,2011,2010,2009,2008,2007,2006,2005,2004,2003,2002,2001,2000,1999,1998,1997,1996,1995,1994,1993,1992,1991,1990,1989,1988,1987,1986,1985,1984,1983,1982,1981,1980,1979,1978,1977,1976,1975,1974,1973,1972,1971,1970,1969,1968,1967,1966,1965,1964,1963
Estas estatísticas em outros países:
AfghanistanAlbaniaAlgeriaAndorraAngolaAntigua and BarbudaArab WorldArgentinaArmeniaArubaAustraliaAustriaAzerbaijanBahamas, TheBahrainBangladeshBarbadosBelarusBelgiumBelizeBeninBermudaBhutanBoliviaBosnia and HerzegovinaBotswanaBrazilBrunei DarussalamBulgariaBurkina FasoBurundiCabo VerdeCambodiaCameroonCanadaCaribbean small statesCayman IslandsCentral African RepublicCentral Europe and the BalticsChadChileChinaColombiaComorosCongo, Dem. Rep.Congo, Rep.Costa RicaCote d'IvoireCroatiaCubaCyprusCzech RepublicDenmarkDjiboutiDominicaDominican RepublicEarly-demographic dividendEast Asia & PacificEast Asia & Pacific (excluding high income)East Asia & Pacific (IDA & IBRD countries)EcuadorEgypt, Arab Rep.El SalvadorEquatorial GuineaEritreaEstoniaEthiopiaEuro areaEurope & Central AsiaEurope & Central Asia (excluding high income)Europe & Central Asia (IDA & IBRD countries)European UnionFaroe IslandsFijiFinlandFragile and conflict affected situationsFranceFrench PolynesiaGabonGambia, TheGeorgiaGermanyGhanaGreeceGreenlandGrenadaGuatemalaGuineaGuinea-BissauGuyanaHaitiHeavily indebted poor countries (HIPC)High incomeHondurasHong Kong SAR, ChinaHungaryIBRD onlyIcelandIDA & IBRD totalIDA blendIDA onlyIDA totalIndiaIndonesiaIran, Islamic Rep.IraqIrelandIsraelItalyJamaicaJapanJordanKazakhstanKenyaKiribatiKorea, Rep.KuwaitKyrgyz RepublicLao PDRLate-demographic dividendLatin America & Caribbean Latin America & Caribbean (excluding high income)Latin America & the Caribbean (IDA & IBRD countries)LatviaLeast developed countries: UN classificationLebanonLesothoLiberiaLibyaLithuaniaLow & middle incomeLow incomeLower middle incomeLuxembourgMacao SAR, ChinaMacedonia, FYRMadagascarMalawiMalaysiaMaldivesMaliMaltaMauritaniaMauritiusMexicoMiddle East & North AfricaMiddle East & North Africa (excluding high income)Middle East & North Africa (IDA & IBRD countries)Middle incomeMoldovaMongoliaMoroccoMozambiqueMyanmarNamibiaNepalNetherlandsNew CaledoniaNew ZealandNicaraguaNigerNigeriaNorth AmericaNorwayOECD membersOmanOther small statesPacific island small statesPakistanPalauPanamaPapua New GuineaParaguayPeruPhilippinesPolandPortugalPost-demographic dividendPre-demographic dividendQatarRomaniaRussian FederationRwandaSamoaSao Tome and PrincipeSaudi ArabiaSenegalSerbiaSeychellesSierra LeoneSingaporeSlovak RepublicSloveniaSmall statesSolomon IslandsSomaliaSouth AfricaSouth AsiaSouth Asia (IDA & IBRD)SpainSri LankaSt. Kitts and NevisSt. LuciaSt. Vincent and the GrenadinesSub-Saharan Africa Sub-Saharan Africa (excluding high income)Sub-Saharan Africa (IDA & IBRD countries)SudanSurinameSwazilandSwedenSwitzerlandSyrian Arab RepublicTajikistanTanzaniaThailandTimor-LesteTogoTongaTrinidad and TobagoTunisiaTurkeyTurkmenistanTurks and Caicos IslandsTuvaluUgandaUkraineUnited Arab EmiratesUnited KingdomUnited StatesUpper middle incomeUruguayVanuatuVenezuela, RBVietnamVirgin Islands (U.S.)WorldYemen, Rep.ZambiaZimbabwe Linha do tempo:
Nesta escala de tempo está apresentado um gráfico de 1963 ano até 2016 ano Philippines. Dados de 1962 ano ausente. O número de observações reais por data: 54.
Fonte (nome):
Indicadores de desenvolvimento mundial
Fonte (organização):
World Bank staff estimates from the Comtrade database maintained by the United Nations Statistics Division.
Categorias:
Private Sector, Trade
Foi atualizado:
23 abr 2017 ano
Indicadores de alterações dos valores ao longo dos anos
Mínimo:
6.479
1 jan 2004 ano
Máximo:
20.354
1 jan 1966 ano
Na data de observação
Valor
Mudança absoluta
A alteração em relação ao valor anterior
1 jan 1963 ano
15.835
+15.835
0.0%
1 jan 1964 ano
14.41
-1.425
-9.0%
1 jan 1965 ano
16.726
+2.317
16.08%
1 jan 1966 ano
20.354
+3.628
21.69%
1 jan 1967 ano
15.842
-4.512
-22.17%
1 jan 1968 ano
16.145
+0.303
1.91%
1 jan 1969 ano
13.249
-2.896
-17.94%
1 jan 1970 ano
12.791
-0.457
-3.45%
1 jan 1971 ano
11.22
-1.571
-12.28%
1 jan 1972 ano
13.64
+2.42
21.57%
1 jan 1973 ano
15.259
+1.619
11.87%
1 jan 1974 ano
13.87
-1.389
-9.1%
1 jan 1975 ano
11.109
-2.762
-19.91%
1 jan 1976 ano
10.493
-0.616
-5.55%
1 jan 1977 ano
9.88
-0.613
-5.84%
1 jan 1978 ano
9.53
-0.351
-3.55%
1 jan 1979 ano
7.978
-1.552
-16.28%
1 jan 1980 ano
7.379
-0.599
-7.5%
1 jan 1981 ano
7.814
+0.435
5.89%
1 jan 1982 ano
8.502
+0.688
8.8%
1 jan 1983 ano
8.355
-0.146
-1.72%
1 jan 1984 ano
8.863
+0.508
6.08%
1 jan 1985 ano
8.539
-0.325
-3.66%
1 jan 1986 ano
10.712
+2.173
25.45%
1 jan 1987 ano
10.267
-0.445
-4.15%
1 jan 1988 ano
8.54
-1.727
-16.82%
1 jan 1989 ano
10.548
+2.008
23.52%
1 jan 1990 ano
10.195
-0.353
-3.35%
1 jan 1991 ano
10.338
+0.143
1.4%
1 jan 1992 ano
8.542
-1.796
-17.37%
1 jan 1993 ano
8.437
-0.105
-1.23%
1 jan 1994 ano
7.783
-0.654
-7.76%
1 jan 1995 ano
8.1
+0.317
4.07%
1 jan 1996 ano
8.347
+0.247
3.05%
1 jan 1997 ano
8.137
-0.21
-2.51%
1 jan 1998 ano
7.61
-0.527
-6.48%
1 jan 1999 ano
8.807
+1.197
15.73%
1 jan 2000 ano
8.268
-0.54
-6.13%
1 jan 2001 ano
7.027
-1.24
-15.0%
1 jan 2002 ano
7.646
+0.619
8.81%
1 jan 2003 ano
7.059
-0.587
-7.68%
1 jan 2004 ano
6.479
-0.58
-8.21%
1 jan 2005 ano
6.756
+0.277
4.28%
1 jan 2006 ano
6.948
+0.192
2.84%
1 jan 2007 ano
6.771
-0.177
-2.55%
1 jan 2008 ano
7.333
+0.563
8.31%
1 jan 2009 ano
10.828
+3.495
47.65%
1 jan 2010 ano
11.567
+0.739
6.83%
1 jan 2011 ano
11.098
-0.469
-4.05%
1 jan 2012 ano
10.335
-0.764
-6.88%
1 jan 2013 ano
10.471
+0.136
1.32%
1 jan 2014 ano
10.265
-0.206
-1.97%
1 jan 2015 ano
12.224
+1.96
19.09%
1 jan 2016 ano
11.739
-0.485
-3.97%
Classificação de países por estatísticas atuais por anos


Comentários: