29
/pt/
pt
AIzaSyAYiBZKx7MnpbEhh9jyipgxe19OcubqV5w
April 1, 2024
84553
Benin
BEN
true
2
1
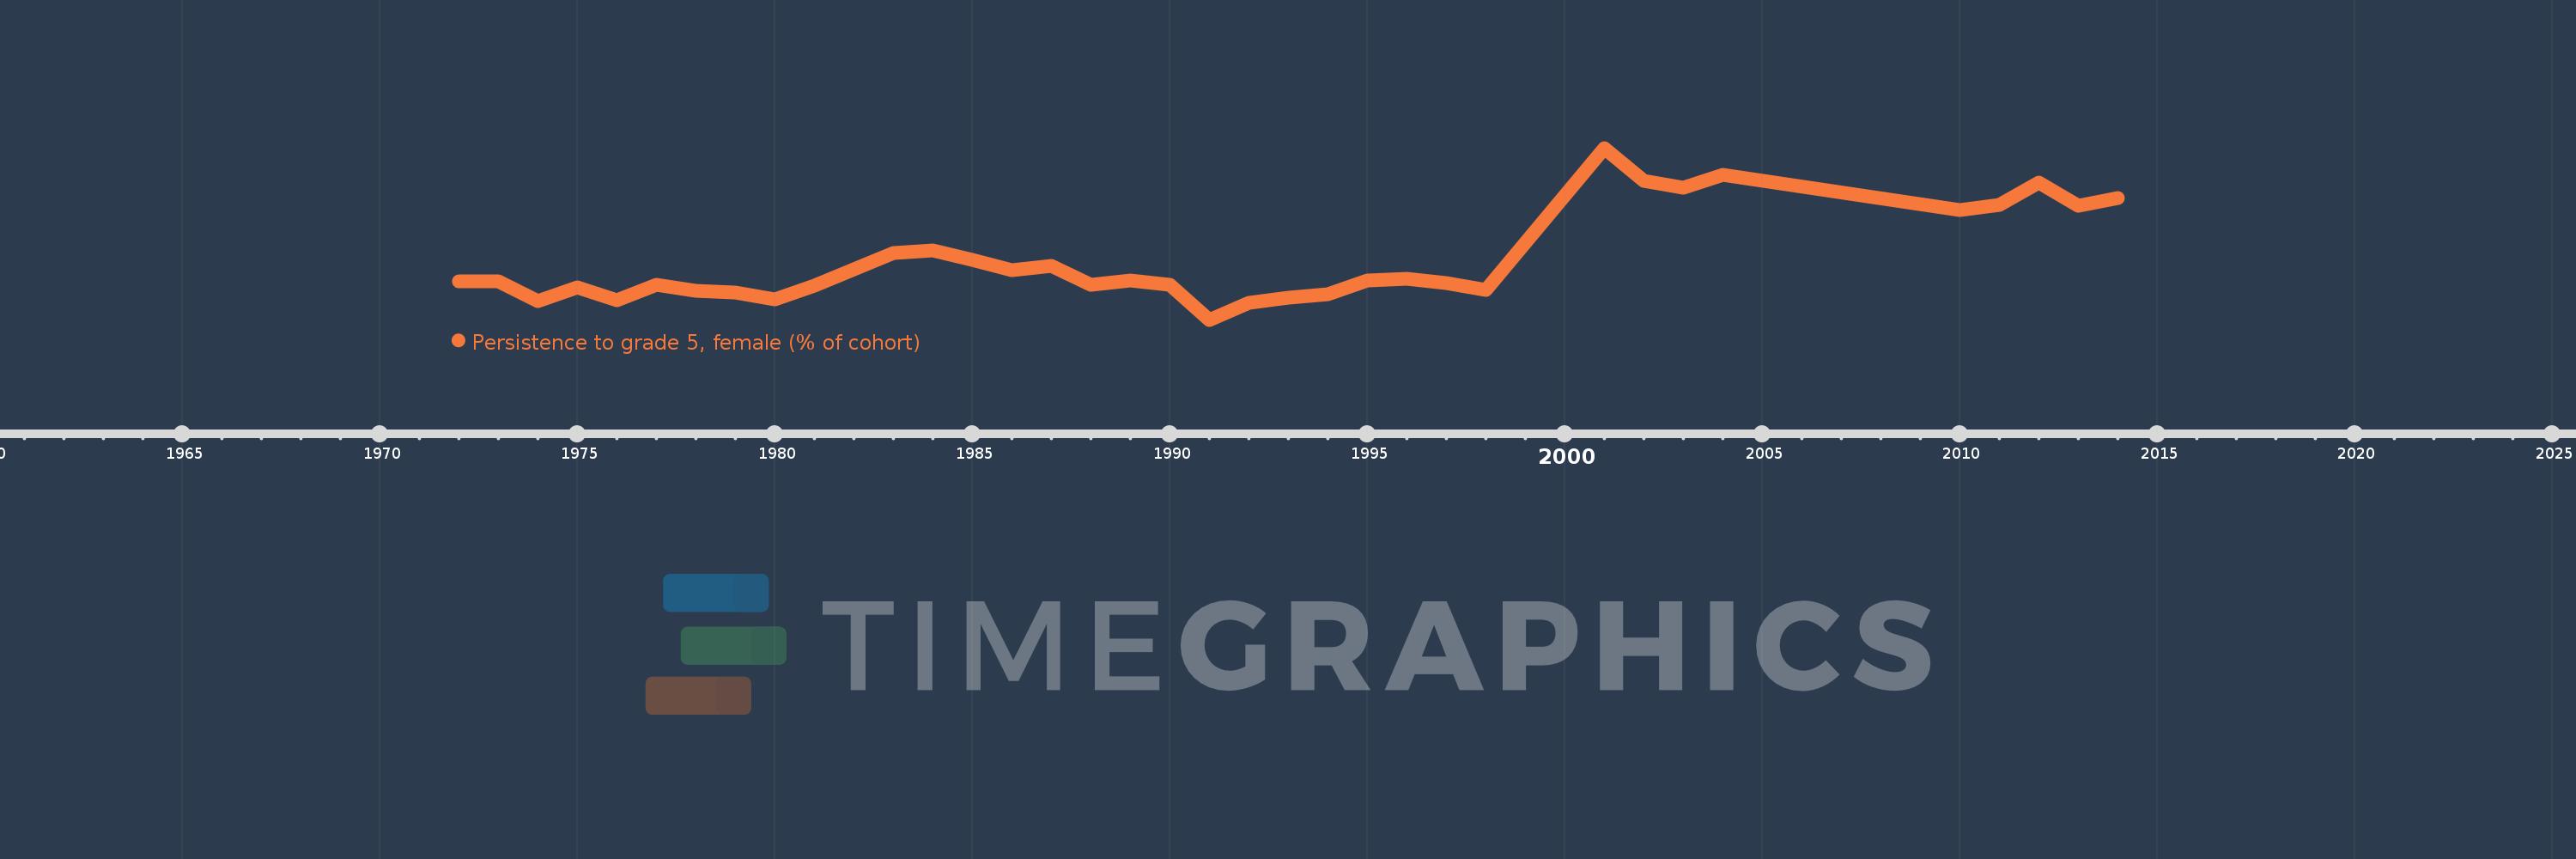
Persistence to grade 5, female (% of cohort)
2014,2013,2012,2011,2010,2004,2003,2002,2001,1998,1997,1996,1995,1994,1993,1992,1991,1990,1989,1988,1987,1986,1985,1984,1983,1981,1980,1979,1978,1977,1976,1975,1974,1973,1972
Estas estatísticas em outros países:
AfghanistanAlbaniaAlgeriaAndorraAngolaAntigua and BarbudaArab WorldArgentinaArubaBahamas, TheBahrainBangladeshBarbadosBelgiumBelizeBeninBermudaBhutanBoliviaBosnia and HerzegovinaBotswanaBrunei DarussalamBurkina FasoBurundiCabo VerdeCambodiaCameroonCanadaCaribbean small statesCayman IslandsCentral African RepublicChadChileChinaColombiaComorosCongo, Dem. Rep.Congo, Rep.Costa RicaCote d'IvoireCubaCyprusCzech RepublicDenmarkDjiboutiDominicaDominican RepublicEarly-demographic dividendEast Asia & PacificEast Asia & Pacific (excluding high income)East Asia & Pacific (IDA & IBRD countries)EcuadorEgypt, Arab Rep.El SalvadorEquatorial GuineaEritreaEstoniaEthiopiaFijiFinlandFranceGabonGambia, TheGeorgiaGhanaGreeceGrenadaGuatemalaGuineaGuinea-BissauGuyanaHaitiHeavily indebted poor countries (HIPC)HondurasHong Kong SAR, ChinaHungaryIcelandIDA blendIDA onlyIDA totalIndiaIndonesiaIran, Islamic Rep.IraqIrelandIsraelItalyJamaicaJapanJordanKenyaKiribatiKorea, Rep.KuwaitLao PDRLate-demographic dividendLatviaLeast developed countries: UN classificationLebanonLesothoLiberiaLibyaLiechtensteinLow incomeLower middle incomeLuxembourgMacao SAR, ChinaMadagascarMalawiMalaysiaMaldivesMaliMaltaMarshall IslandsMauritaniaMauritiusMexicoMiddle East & North AfricaMiddle East & North Africa (excluding high income)Middle East & North Africa (IDA & IBRD countries)MontenegroMoroccoMozambiqueMyanmarNamibiaNepalNetherlandsNicaraguaNigerNigeriaNorwayOmanOther small statesPacific island small statesPakistanPanamaPapua New GuineaParaguayPeruPhilippinesPolandPortugalPre-demographic dividendQatarRwandaSamoaSan MarinoSao Tome and PrincipeSaudi ArabiaSenegalSeychellesSierra LeoneSingaporeSloveniaSolomon IslandsSouth AfricaSouth AsiaSouth Asia (IDA & IBRD)SpainSri LankaSt. Kitts and NevisSt. LuciaSt. Vincent and the GrenadinesSub-Saharan Africa Sub-Saharan Africa (excluding high income)Sub-Saharan Africa (IDA & IBRD countries)SudanSurinameSwazilandSwedenSwitzerlandSyrian Arab RepublicTanzaniaThailandTimor-LesteTogoTongaTrinidad and TobagoTunisiaTurkeyUgandaUnited Arab EmiratesUpper middle incomeUruguayVanuatuVenezuela, RBVietnamYemen, Rep.ZambiaZimbabwe Linha do tempo:
Nesta escala de tempo está apresentado um gráfico de 1972 ano até 2014 ano Benin. Dados de 1971 ano ausente. O número de observações reais por data: 35.
Fonte (nome):
Indicadores de desenvolvimento mundial
Fonte (organização):
United Nations Educational, Scientific, and Cultural Organization (UNESCO) Institute for Statistics.
Categorias:
Education, Gender
Foi atualizado:
23 abr 2017 ano
Indicadores de alterações dos valores ao longo dos anos
Mínimo:
25.971
1 jan 1991 ano
Máximo:
77.716
1 jan 2001 ano
Na data de observação
Valor
Mudança absoluta
A alteração em relação ao valor anterior
1 jan 1972 ano
37.51
+37.51
0.0%
1 jan 1973 ano
37.468
-0.042
-0.11%
1 jan 1974 ano
31.523
-5.945
-15.87%
1 jan 1975 ano
35.848
+4.326
13.72%
1 jan 1976 ano
31.821
-4.027
-11.23%
1 jan 1977 ano
36.58
+4.759
14.95%
1 jan 1978 ano
34.722
-1.859
-5.08%
1 jan 1979 ano
34.242
-0.479
-1.38%
1 jan 1980 ano
32.207
-2.035
-5.94%
1 jan 1981 ano
36.236
+4.029
12.51%
1 jan 1983 ano
46.018
+9.782
27.0%
1 jan 1984 ano
46.759
+0.741
1.61%
1 jan 1985 ano
43.906
-2.853
-6.1%
1 jan 1986 ano
40.935
-2.972
-6.77%
1 jan 1987 ano
42.128
+1.193
2.91%
1 jan 1988 ano
36.479
-5.648
-13.41%
1 jan 1989 ano
37.757
+1.278
3.5%
1 jan 1990 ano
36.409
-1.348
-3.57%
1 jan 1991 ano
25.971
-10.438
-28.67%
1 jan 1992 ano
31.017
+5.046
19.43%
1 jan 1993 ano
32.657
+1.639
5.28%
1 jan 1994 ano
33.548
+0.892
2.73%
1 jan 1995 ano
37.725
+4.176
12.45%
1 jan 1996 ano
38.311
+0.586
1.55%
1 jan 1997 ano
36.981
-1.329
-3.47%
1 jan 1998 ano
34.822
-2.159
-5.84%
1 jan 2001 ano
77.716
+42.894
123.18%
1 jan 2002 ano
67.781
-9.935
-12.78%
1 jan 2003 ano
65.811
-1.97
-2.91%
1 jan 2004 ano
69.589
+3.778
5.74%
1 jan 2010 ano
58.938
-10.65
-15.3%
1 jan 2011 ano
60.685
+1.746
2.96%
1 jan 2012 ano
67.277
+6.592
10.86%
1 jan 2013 ano
60.408
-6.869
-10.21%
1 jan 2014 ano
62.546
+2.138
3.54%
Classificação de países por estatísticas atuais por anos


Comentários: