29
/pt/
pt
AIzaSyAYiBZKx7MnpbEhh9jyipgxe19OcubqV5w
April 1, 2024
137179
Gambia, The
GMB
true
2
1
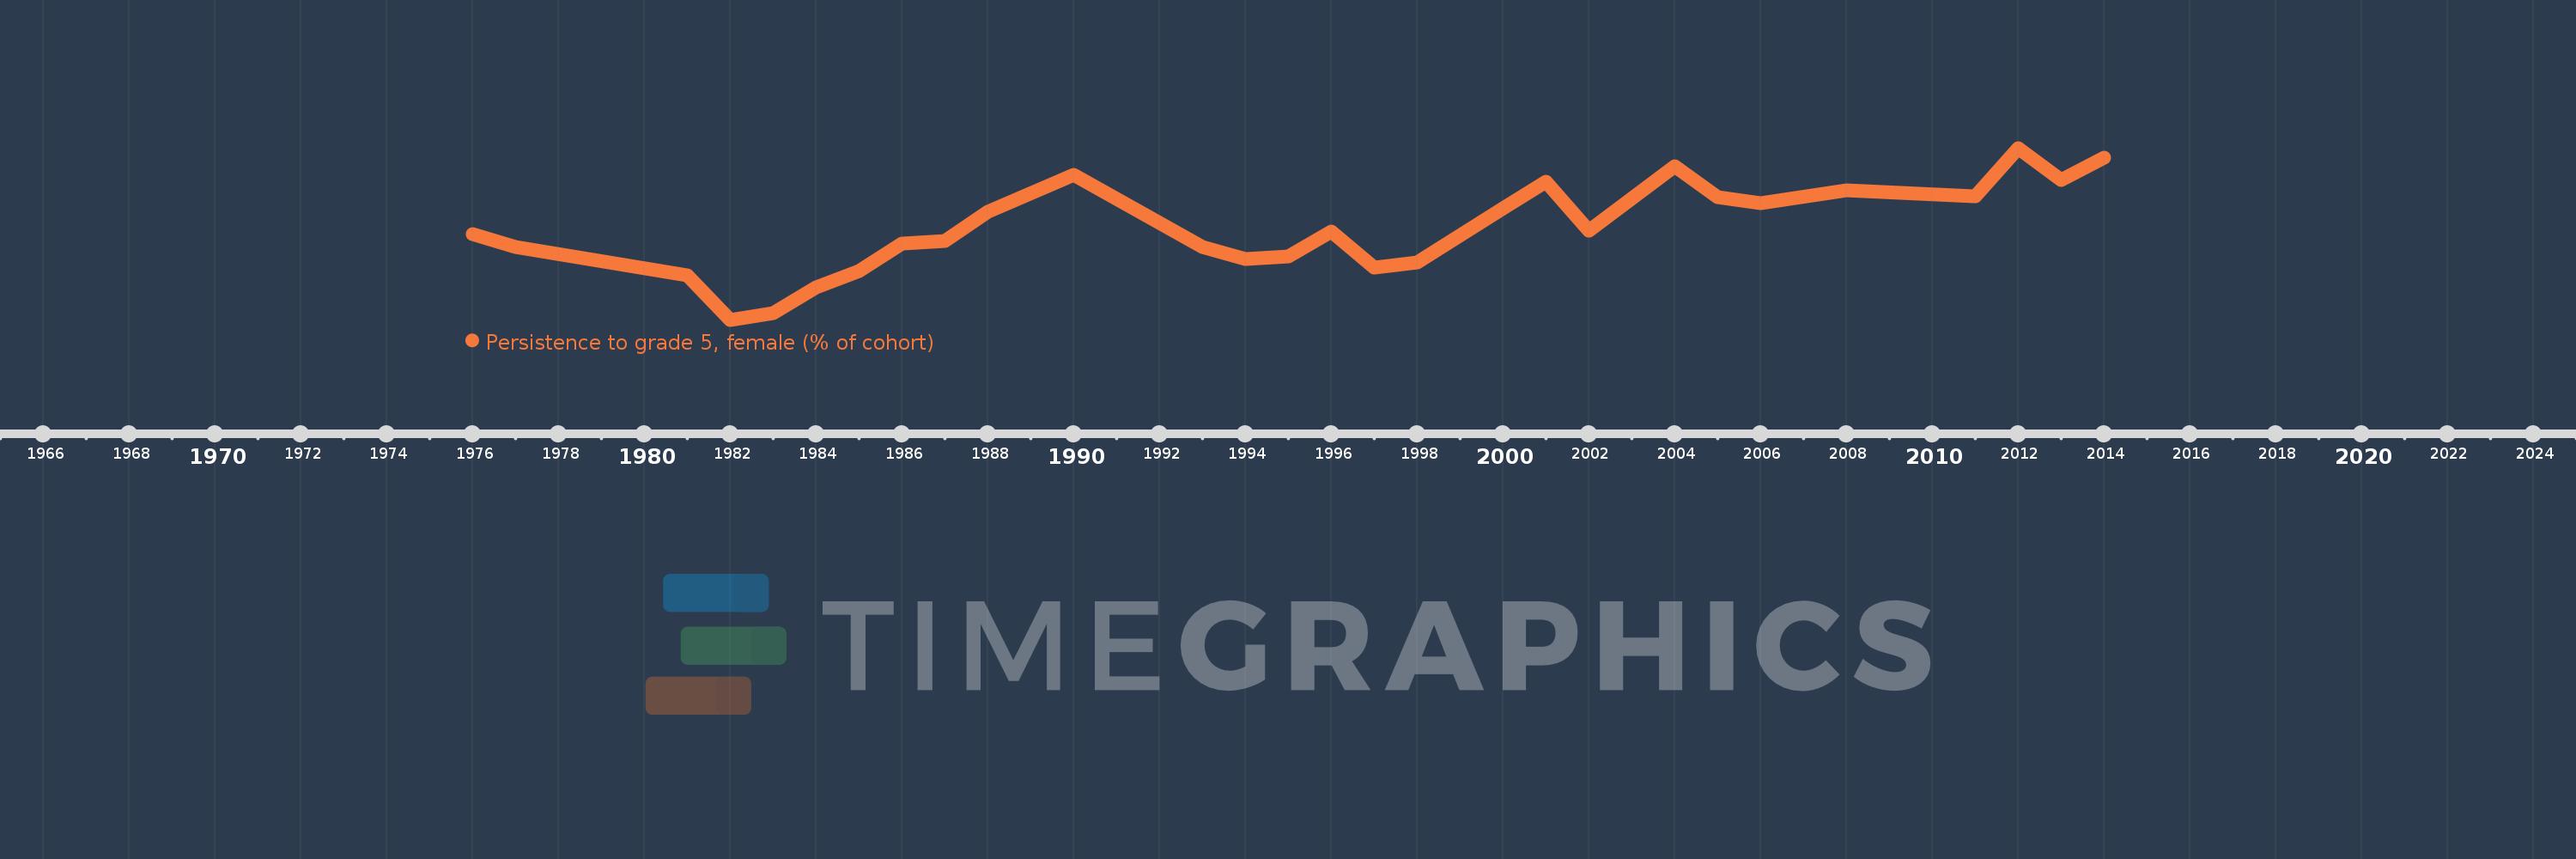
Persistence to grade 5, female (% of cohort)
2014,2013,2012,2011,2008,2006,2005,2004,2002,2001,2000,1998,1997,1996,1995,1994,1993,1990,1988,1987,1986,1985,1984,1983,1982,1981,1977,1976
Estas estatísticas em outros países:
AfghanistanAlbaniaAlgeriaAndorraAngolaAntigua and BarbudaArab WorldArgentinaArubaBahamas, TheBahrainBangladeshBarbadosBelgiumBelizeBeninBermudaBhutanBoliviaBosnia and HerzegovinaBotswanaBrunei DarussalamBurkina FasoBurundiCabo VerdeCambodiaCameroonCanadaCaribbean small statesCayman IslandsCentral African RepublicChadChileChinaColombiaComorosCongo, Dem. Rep.Congo, Rep.Costa RicaCote d'IvoireCubaCyprusCzech RepublicDenmarkDjiboutiDominicaDominican RepublicEarly-demographic dividendEast Asia & PacificEast Asia & Pacific (excluding high income)East Asia & Pacific (IDA & IBRD countries)EcuadorEgypt, Arab Rep.El SalvadorEquatorial GuineaEritreaEstoniaEthiopiaFijiFinlandFranceGabonGambia, TheGeorgiaGhanaGreeceGrenadaGuatemalaGuineaGuinea-BissauGuyanaHaitiHeavily indebted poor countries (HIPC)HondurasHong Kong SAR, ChinaHungaryIcelandIDA blendIDA onlyIDA totalIndiaIndonesiaIran, Islamic Rep.IraqIrelandIsraelItalyJamaicaJapanJordanKenyaKiribatiKorea, Rep.KuwaitLao PDRLate-demographic dividendLatviaLeast developed countries: UN classificationLebanonLesothoLiberiaLibyaLiechtensteinLow incomeLower middle incomeLuxembourgMacao SAR, ChinaMadagascarMalawiMalaysiaMaldivesMaliMaltaMarshall IslandsMauritaniaMauritiusMexicoMiddle East & North AfricaMiddle East & North Africa (excluding high income)Middle East & North Africa (IDA & IBRD countries)MontenegroMoroccoMozambiqueMyanmarNamibiaNepalNetherlandsNicaraguaNigerNigeriaNorwayOmanOther small statesPacific island small statesPakistanPanamaPapua New GuineaParaguayPeruPhilippinesPolandPortugalPre-demographic dividendQatarRwandaSamoaSan MarinoSao Tome and PrincipeSaudi ArabiaSenegalSeychellesSierra LeoneSingaporeSloveniaSolomon IslandsSouth AfricaSouth AsiaSouth Asia (IDA & IBRD)SpainSri LankaSt. Kitts and NevisSt. LuciaSt. Vincent and the GrenadinesSub-Saharan Africa Sub-Saharan Africa (excluding high income)Sub-Saharan Africa (IDA & IBRD countries)SudanSurinameSwazilandSwedenSwitzerlandSyrian Arab RepublicTanzaniaThailandTimor-LesteTogoTongaTrinidad and TobagoTunisiaTurkeyUgandaUnited Arab EmiratesUpper middle incomeUruguayVanuatuVenezuela, RBVietnamYemen, Rep.ZambiaZimbabwe Linha do tempo:
Nesta escala de tempo está apresentado um gráfico de 1976 ano até 2014 ano Gambia, The. Dados de 1975 ano ausente. O número de observações reais por data: 28.
Fonte (nome):
Indicadores de desenvolvimento mundial
Fonte (organização):
United Nations Educational, Scientific, and Cultural Organization (UNESCO) Institute for Statistics.
Categorias:
Education, Gender
Foi atualizado:
23 abr 2017 ano
Indicadores de alterações dos valores ao longo dos anos
Mínimo:
29.596
1 jan 1982 ano
Máximo:
86.003
1 jan 2012 ano
Na data de observação
Valor
Mudança absoluta
A alteração em relação ao valor anterior
1 jan 1976 ano
57.584
+57.584
0.0%
1 jan 1977 ano
53.371
-4.212
-7.32%
1 jan 1981 ano
44.081
-9.29
-17.41%
1 jan 1982 ano
29.596
-14.486
-32.86%
1 jan 1983 ano
31.699
+2.104
7.11%
1 jan 1984 ano
40.357
+8.657
27.31%
1 jan 1985 ano
45.725
+5.369
13.3%
1 jan 1986 ano
54.55
+8.825
19.3%
1 jan 1987 ano
55.373
+0.823
1.51%
1 jan 1988 ano
65.138
+9.765
17.63%
1 jan 1990 ano
77.276
+12.138
18.63%
1 jan 1993 ano
53.399
-23.877
-30.9%
1 jan 1994 ano
49.539
-3.86
-7.23%
1 jan 1995 ano
50.49
+0.951
1.92%
1 jan 1996 ano
58.504
+8.014
15.87%
1 jan 1997 ano
46.772
-11.732
-20.05%
1 jan 1998 ano
48.321
+1.549
3.31%
1 jan 2000 ano
66.218
+17.897
37.04%
1 jan 2001 ano
75.014
+8.796
13.28%
1 jan 2002 ano
58.807
-16.207
-21.61%
1 jan 2004 ano
79.919
+21.112
35.9%
1 jan 2005 ano
69.752
-10.167
-12.72%
1 jan 2006 ano
67.848
-1.904
-2.73%
1 jan 2008 ano
72.142
+4.294
6.33%
1 jan 2011 ano
70.058
-2.084
-2.89%
1 jan 2012 ano
86.003
+15.945
22.76%
1 jan 2013 ano
75.504
-10.499
-12.21%
1 jan 2014 ano
82.86
+7.356
9.74%
Classificação de países por estatísticas atuais por anos


Comentários: