29
/pt/
pt
AIzaSyAYiBZKx7MnpbEhh9jyipgxe19OcubqV5w
April 1, 2024
81803
Belgium
BEL
true
2
1
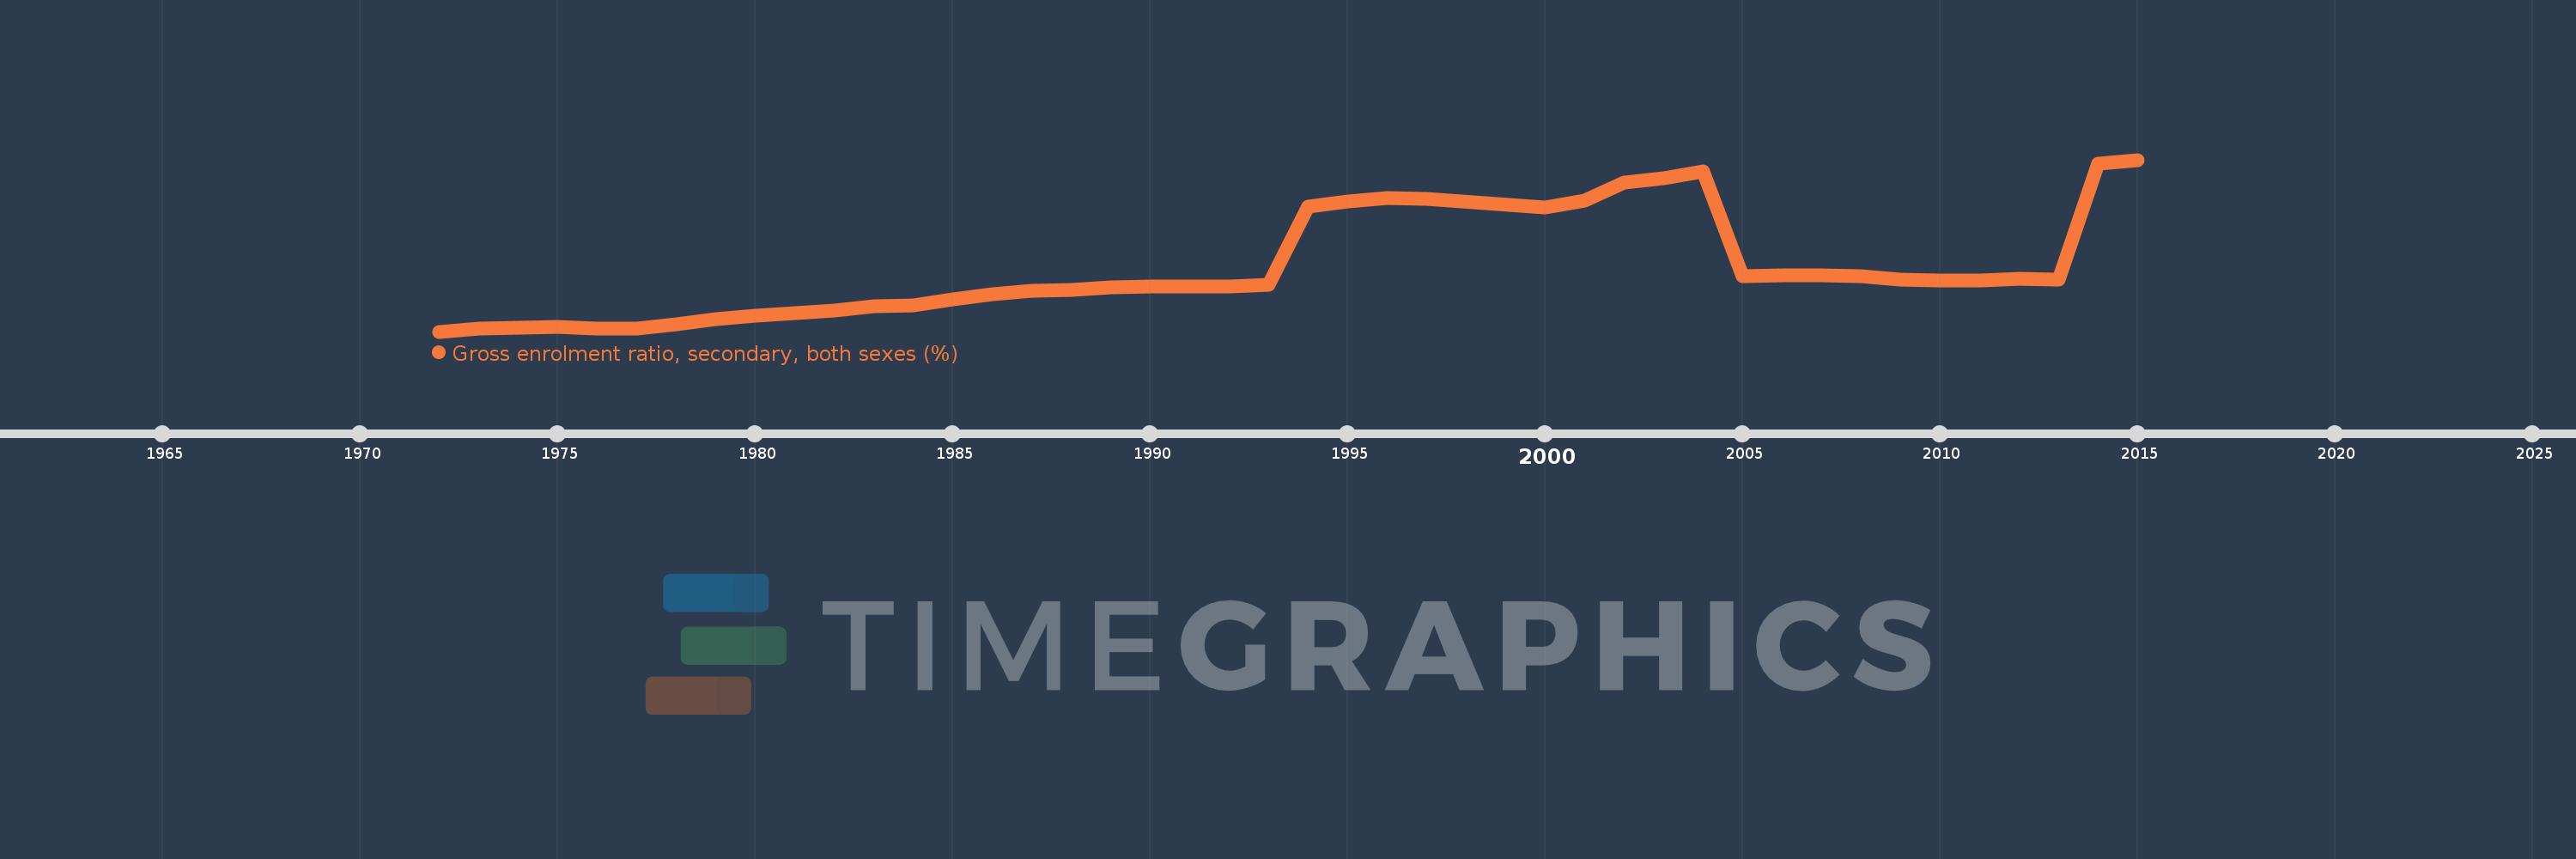
Gross enrolment ratio, secondary, both sexes (%)
2015,2014,2013,2012,2011,2010,2009,2008,2007,2006,2005,2004,2003,2002,2001,2000,1997,1996,1995,1994,1993,1992,1991,1990,1989,1988,1987,1986,1985,1984,1983,1982,1981,1980,1979,1978,1977,1976,1975,1974,1973,1972
Estas estatísticas em outros países:
AfghanistanAlbaniaAlgeriaAndorraAngolaAntigua and BarbudaArab WorldArgentinaArmeniaArubaAustraliaAustriaAzerbaijanBahamas, TheBahrainBangladeshBarbadosBelarusBelgiumBelizeBeninBermudaBhutanBoliviaBosnia and HerzegovinaBotswanaBrazilBritish Virgin IslandsBrunei DarussalamBulgariaBurkina FasoBurundiCabo VerdeCambodiaCameroonCanadaCaribbean small statesCentral African RepublicCentral Europe and the BalticsChadChileChinaColombiaComorosCongo, Dem. Rep.Congo, Rep.Costa RicaCote d'IvoireCroatiaCubaCuracaoCyprusCzech RepublicDenmarkDjiboutiDominicaDominican RepublicEarly-demographic dividendEast Asia & PacificEast Asia & Pacific (excluding high income)East Asia & Pacific (IDA & IBRD countries)EcuadorEgypt, Arab Rep.El SalvadorEquatorial GuineaEritreaEstoniaEthiopiaEuro areaEurope & Central AsiaEurope & Central Asia (excluding high income)Europe & Central Asia (IDA & IBRD countries)European UnionFijiFinlandFragile and conflict affected situationsFranceGabonGambia, TheGeorgiaGermanyGhanaGreeceGrenadaGuatemalaGuineaGuinea-BissauGuyanaHaitiHeavily indebted poor countries (HIPC)High incomeHondurasHong Kong SAR, ChinaHungaryIBRD onlyIcelandIDA & IBRD totalIDA blendIDA onlyIDA totalIndiaIndonesiaIran, Islamic Rep.IraqIrelandIsraelItalyJamaicaJapanJordanKazakhstanKenyaKiribatiKorea, Dem. People’s Rep.Korea, Rep.KuwaitKyrgyz RepublicLao PDRLate-demographic dividendLatin America & Caribbean Latin America & Caribbean (excluding high income)Latin America & the Caribbean (IDA & IBRD countries)LatviaLeast developed countries: UN classificationLebanonLesothoLiberiaLibyaLiechtensteinLithuaniaLow & middle incomeLow incomeLower middle incomeLuxembourgMacao SAR, ChinaMacedonia, FYRMadagascarMalawiMalaysiaMaldivesMaliMaltaMarshall IslandsMauritaniaMauritiusMexicoMicronesia, Fed. Sts.Middle East & North AfricaMiddle East & North Africa (excluding high income)Middle East & North Africa (IDA & IBRD countries)Middle incomeMoldovaMongoliaMontenegroMoroccoMozambiqueMyanmarNamibiaNauruNepalNetherlandsNew ZealandNicaraguaNigerNigeriaNorth AmericaNorwayOECD membersOmanOther small statesPacific island small statesPakistanPalauPanamaPapua New GuineaParaguayPeruPhilippinesPolandPortugalPost-demographic dividendPre-demographic dividendPuerto RicoQatarRomaniaRussian FederationRwandaSamoaSan MarinoSao Tome and PrincipeSaudi ArabiaSenegalSerbiaSeychellesSierra LeoneSlovak RepublicSloveniaSmall statesSolomon IslandsSomaliaSouth AfricaSouth AsiaSouth Asia (IDA & IBRD)SpainSri LankaSt. Kitts and NevisSt. LuciaSt. Vincent and the GrenadinesSub-Saharan Africa Sub-Saharan Africa (excluding high income)Sub-Saharan Africa (IDA & IBRD countries)SudanSurinameSwazilandSwedenSwitzerlandSyrian Arab RepublicTajikistanTanzaniaThailandTimor-LesteTogoTongaTrinidad and TobagoTunisiaTurkeyTurkmenistanTuvaluUgandaUkraineUnited Arab EmiratesUnited KingdomUnited StatesUpper middle incomeUruguayUzbekistanVanuatuVenezuela, RBVietnamWest Bank and GazaWorldYemen, Rep.ZambiaZimbabwe Linha do tempo:
Nesta escala de tempo está apresentado um gráfico de 1972 ano até 2015 ano Belgium. Dados de 1971 ano ausente. O número de observações reais por data: 42.
Fonte (nome):
Indicadores de desenvolvimento mundial
Fonte (organização):
UNESCO Institute for Statistics
Categorias:
Education
Foi atualizado:
23 abr 2017 ano
Indicadores de alterações dos valores ao longo dos anos
Mínimo:
80.803
1 jan 1972 ano
Máximo:
164.812
1 jan 2015 ano
Na data de observação
Valor
Mudança absoluta
A alteração em relação ao valor anterior
1 jan 1972 ano
80.803
+80.803
0.0%
1 jan 1973 ano
82.193
+1.391
1.72%
1 jan 1974 ano
82.57
+0.376
0.46%
1 jan 1975 ano
82.958
+0.389
0.47%
1 jan 1976 ano
82.452
-0.507
-0.61%
1 jan 1977 ano
82.468
+0.016
0.02%
1 jan 1978 ano
84.2
+1.732
2.1%
1 jan 1979 ano
86.823
+2.623
3.11%
1 jan 1980 ano
88.48
+1.657
1.91%
1 jan 1981 ano
89.711
+1.231
1.39%
1 jan 1982 ano
91.288
+1.577
1.76%
1 jan 1983 ano
93.363
+2.075
2.27%
1 jan 1984 ano
93.681
+0.319
0.34%
1 jan 1985 ano
96.6
+2.919
3.12%
1 jan 1986 ano
99.066
+2.466
2.55%
1 jan 1987 ano
100.763
+1.697
1.71%
1 jan 1988 ano
101.286
+0.523
0.52%
1 jan 1989 ano
102.295
+1.009
1.0%
1 jan 1990 ano
102.704
+0.409
0.4%
1 jan 1991 ano
102.881
+0.178
0.17%
1 jan 1992 ano
102.919
+0.037
0.04%
1 jan 1993 ano
103.564
+0.645
0.63%
1 jan 1994 ano
141.956
+38.392
37.07%
1 jan 1995 ano
144.568
+2.612
1.84%
1 jan 1996 ano
146.141
+1.573
1.09%
1 jan 1997 ano
145.691
-0.449
-0.31%
1 jan 2000 ano
141.383
-4.309
-2.96%
1 jan 2001 ano
144.675
+3.292
2.33%
1 jan 2002 ano
153.784
+9.109
6.3%
1 jan 2003 ano
155.86
+2.076
1.35%
1 jan 2004 ano
158.988
+3.127
2.01%
1 jan 2005 ano
107.916
-51.071
-32.12%
1 jan 2006 ano
108.354
+0.438
0.41%
1 jan 2007 ano
108.504
+0.149
0.14%
1 jan 2008 ano
107.871
-0.633
-0.58%
1 jan 2009 ano
106.413
-1.458
-1.35%
1 jan 2010 ano
105.696
-0.717
-0.67%
1 jan 2011 ano
105.786
+0.09
0.09%
1 jan 2012 ano
106.481
+0.695
0.66%
1 jan 2013 ano
106.309
-0.172
-0.16%
1 jan 2014 ano
163.101
+56.792
53.42%
1 jan 2015 ano
164.812
+1.711
1.05%
Classificação de países por estatísticas atuais por anos


Comentários: