29
/pt/
pt
AIzaSyAYiBZKx7MnpbEhh9jyipgxe19OcubqV5w
April 1, 2024
56265
Small states
SST
false
2
1
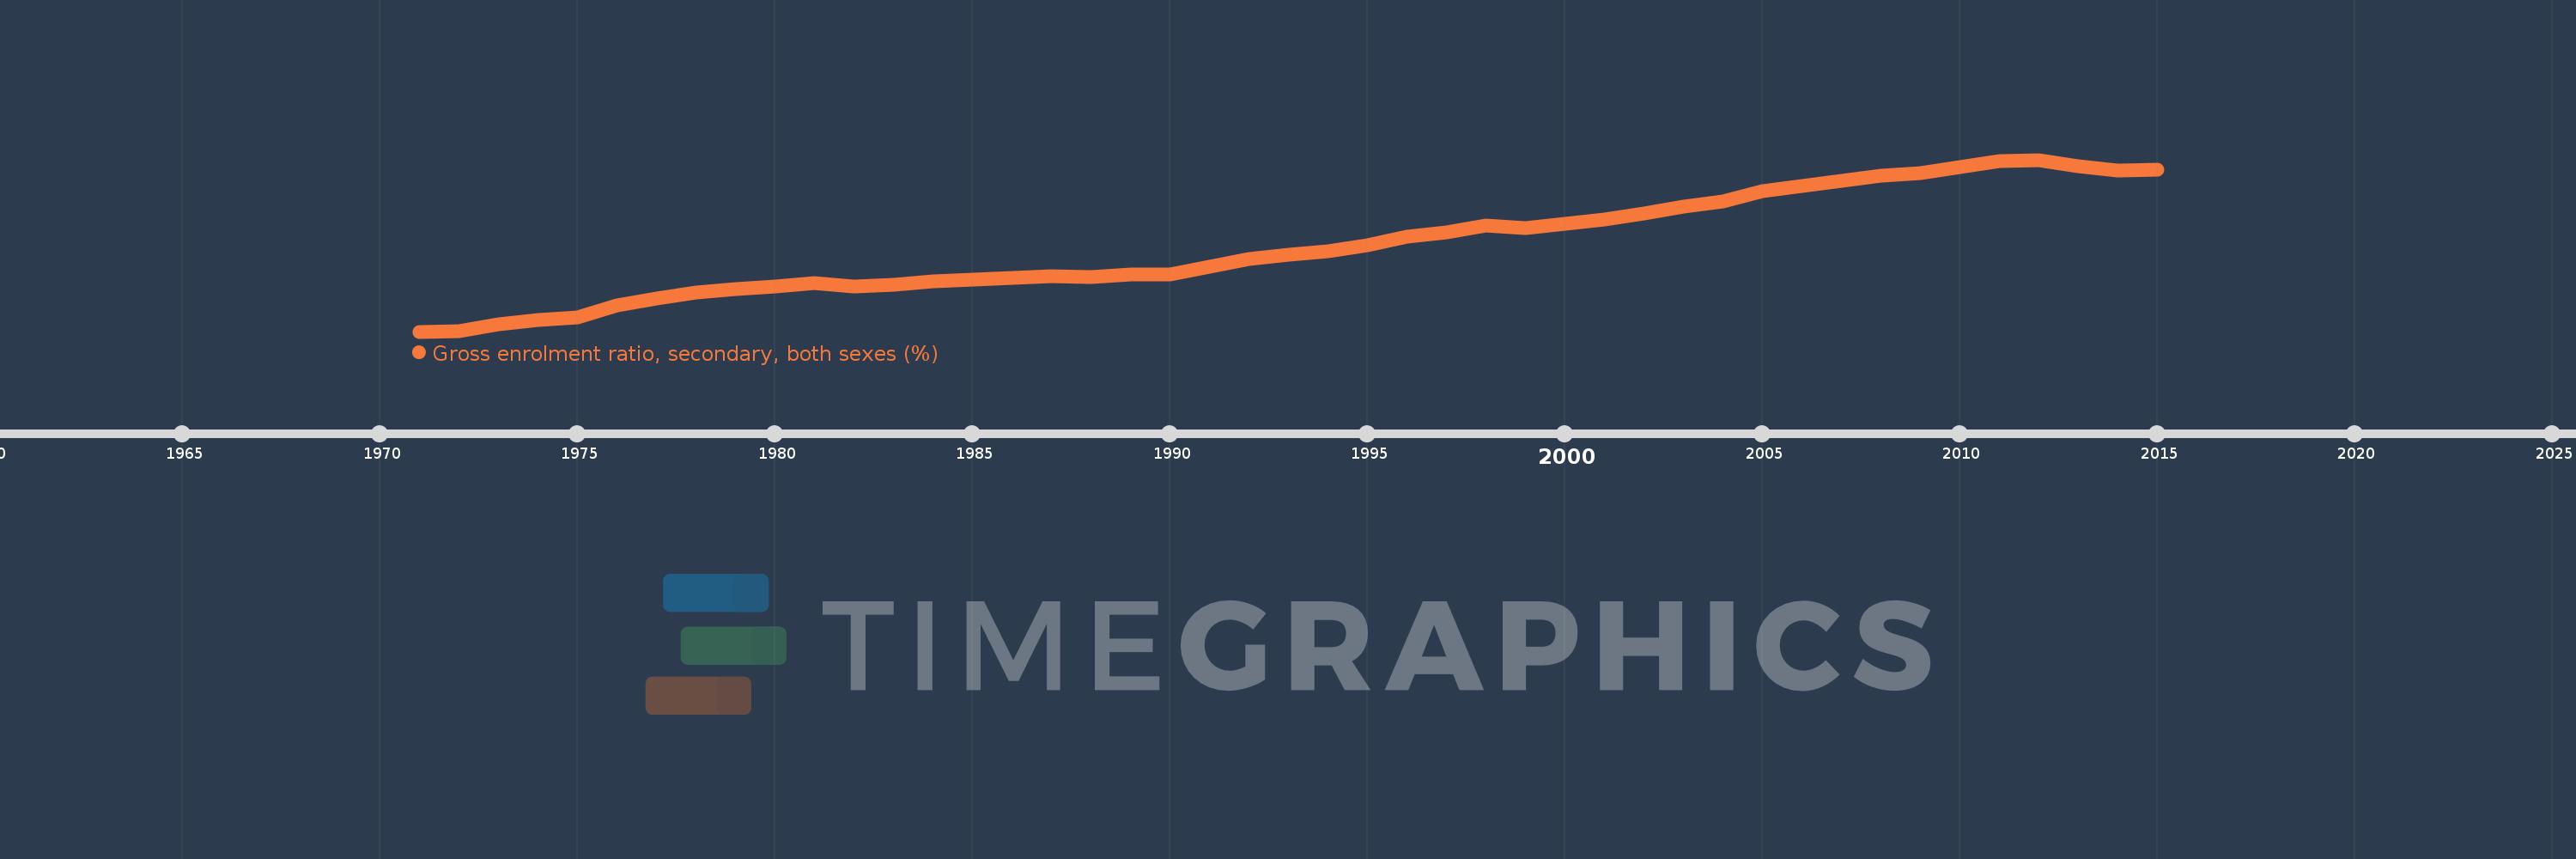
Gross enrolment ratio, secondary, both sexes (%)
2015,2014,2013,2012,2011,2010,2009,2008,2007,2006,2005,2004,2003,2002,2001,2000,1999,1998,1997,1996,1995,1994,1993,1992,1991,1990,1989,1988,1987,1986,1985,1984,1983,1982,1981,1980,1979,1978,1977,1976,1975,1974,1973,1972,1971
Estas estatísticas em outros países:
AfghanistanAlbaniaAlgeriaAndorraAngolaAntigua and BarbudaArab WorldArgentinaArmeniaArubaAustraliaAustriaAzerbaijanBahamas, TheBahrainBangladeshBarbadosBelarusBelgiumBelizeBeninBermudaBhutanBoliviaBosnia and HerzegovinaBotswanaBrazilBritish Virgin IslandsBrunei DarussalamBulgariaBurkina FasoBurundiCabo VerdeCambodiaCameroonCanadaCaribbean small statesCentral African RepublicCentral Europe and the BalticsChadChileChinaColombiaComorosCongo, Dem. Rep.Congo, Rep.Costa RicaCote d'IvoireCroatiaCubaCuracaoCyprusCzech RepublicDenmarkDjiboutiDominicaDominican RepublicEarly-demographic dividendEast Asia & PacificEast Asia & Pacific (excluding high income)East Asia & Pacific (IDA & IBRD countries)EcuadorEgypt, Arab Rep.El SalvadorEquatorial GuineaEritreaEstoniaEthiopiaEuro areaEurope & Central AsiaEurope & Central Asia (excluding high income)Europe & Central Asia (IDA & IBRD countries)European UnionFijiFinlandFragile and conflict affected situationsFranceGabonGambia, TheGeorgiaGermanyGhanaGreeceGrenadaGuatemalaGuineaGuinea-BissauGuyanaHaitiHeavily indebted poor countries (HIPC)High incomeHondurasHong Kong SAR, ChinaHungaryIBRD onlyIcelandIDA & IBRD totalIDA blendIDA onlyIDA totalIndiaIndonesiaIran, Islamic Rep.IraqIrelandIsraelItalyJamaicaJapanJordanKazakhstanKenyaKiribatiKorea, Dem. People’s Rep.Korea, Rep.KuwaitKyrgyz RepublicLao PDRLate-demographic dividendLatin America & Caribbean Latin America & Caribbean (excluding high income)Latin America & the Caribbean (IDA & IBRD countries)LatviaLeast developed countries: UN classificationLebanonLesothoLiberiaLibyaLiechtensteinLithuaniaLow & middle incomeLow incomeLower middle incomeLuxembourgMacao SAR, ChinaMacedonia, FYRMadagascarMalawiMalaysiaMaldivesMaliMaltaMarshall IslandsMauritaniaMauritiusMexicoMicronesia, Fed. Sts.Middle East & North AfricaMiddle East & North Africa (excluding high income)Middle East & North Africa (IDA & IBRD countries)Middle incomeMoldovaMongoliaMontenegroMoroccoMozambiqueMyanmarNamibiaNauruNepalNetherlandsNew ZealandNicaraguaNigerNigeriaNorth AmericaNorwayOECD membersOmanOther small statesPacific island small statesPakistanPalauPanamaPapua New GuineaParaguayPeruPhilippinesPolandPortugalPost-demographic dividendPre-demographic dividendPuerto RicoQatarRomaniaRussian FederationRwandaSamoaSan MarinoSao Tome and PrincipeSaudi ArabiaSenegalSerbiaSeychellesSierra LeoneSlovak RepublicSloveniaSmall statesSolomon IslandsSomaliaSouth AfricaSouth AsiaSouth Asia (IDA & IBRD)SpainSri LankaSt. Kitts and NevisSt. LuciaSt. Vincent and the GrenadinesSub-Saharan Africa Sub-Saharan Africa (excluding high income)Sub-Saharan Africa (IDA & IBRD countries)SudanSurinameSwazilandSwedenSwitzerlandSyrian Arab RepublicTajikistanTanzaniaThailandTimor-LesteTogoTongaTrinidad and TobagoTunisiaTurkeyTurkmenistanTuvaluUgandaUkraineUnited Arab EmiratesUnited KingdomUnited StatesUpper middle incomeUruguayUzbekistanVanuatuVenezuela, RBVietnamWest Bank and GazaWorldYemen, Rep.ZambiaZimbabwe Linha do tempo:
Nesta escala de tempo está apresentado um gráfico de 1971 ano até 2015 ano Small states. Dados de 1970 ano ausente. O número de observações reais por data: 45.
Fonte (nome):
Indicadores de desenvolvimento mundial
Fonte (organização):
UNESCO Institute for Statistics
Categorias:
Education
Foi atualizado:
23 abr 2017 ano
Indicadores de alterações dos valores ao longo dos anos
Mínimo:
41.838
1 jan 1971 ano
Máximo:
71.356
1 jan 2012 ano
Na data de observação
Valor
Mudança absoluta
A alteração em relação ao valor anterior
1 jan 1971 ano
41.838
+41.838
0.0%
1 jan 1972 ano
41.957
+0.119
0.28%
1 jan 1973 ano
43.118
+1.161
2.77%
1 jan 1974 ano
43.879
+0.761
1.76%
1 jan 1975 ano
44.264
+0.386
0.88%
1 jan 1976 ano
46.395
+2.131
4.81%
1 jan 1977 ano
47.571
+1.176
2.54%
1 jan 1978 ano
48.531
+0.96
2.02%
1 jan 1979 ano
49.082
+0.551
1.14%
1 jan 1980 ano
49.618
+0.536
1.09%
1 jan 1981 ano
50.222
+0.604
1.22%
1 jan 1982 ano
49.614
-0.608
-1.21%
1 jan 1983 ano
49.886
+0.272
0.55%
1 jan 1984 ano
50.487
+0.601
1.2%
1 jan 1985 ano
50.73
+0.244
0.48%
1 jan 1986 ano
51.134
+0.403
0.79%
1 jan 1987 ano
51.292
+0.159
0.31%
1 jan 1988 ano
51.279
-0.014
-0.03%
1 jan 1989 ano
51.611
+0.332
0.65%
1 jan 1990 ano
51.601
-0.01
-0.02%
1 jan 1991 ano
52.942
+1.341
2.6%
1 jan 1992 ano
54.244
+1.303
2.46%
1 jan 1993 ano
55.022
+0.778
1.43%
1 jan 1994 ano
55.69
+0.668
1.21%
1 jan 1995 ano
56.638
+0.948
1.7%
1 jan 1996 ano
58.151
+1.514
2.67%
1 jan 1997 ano
58.941
+0.789
1.36%
1 jan 1998 ano
60.09
+1.149
1.95%
1 jan 1999 ano
59.682
-0.408
-0.68%
1 jan 2000 ano
60.355
+0.673
1.13%
1 jan 2001 ano
61.094
+0.739
1.22%
1 jan 2002 ano
62.135
+1.041
1.7%
1 jan 2003 ano
63.277
+1.142
1.84%
1 jan 2004 ano
64.247
+0.97
1.53%
1 jan 2005 ano
66.026
+1.78
2.77%
1 jan 2006 ano
66.807
+0.781
1.18%
1 jan 2007 ano
67.722
+0.915
1.37%
1 jan 2008 ano
68.587
+0.865
1.28%
1 jan 2009 ano
69.059
+0.472
0.69%
1 jan 2010 ano
70.138
+1.079
1.56%
1 jan 2011 ano
71.098
+0.96
1.37%
1 jan 2012 ano
71.356
+0.257
0.36%
1 jan 2013 ano
70.261
-1.095
-1.53%
1 jan 2014 ano
69.529
-0.732
-1.04%
1 jan 2015 ano
69.692
+0.163
0.23%
Classificação de países por estatísticas atuais por anos


Comentários: