30
/pt/
AIzaSyAYiBZKx7MnpbEhh9jyipgxe19OcubqV5w
April 1, 2024
77785
Bangladesh
BGD
true
2
1
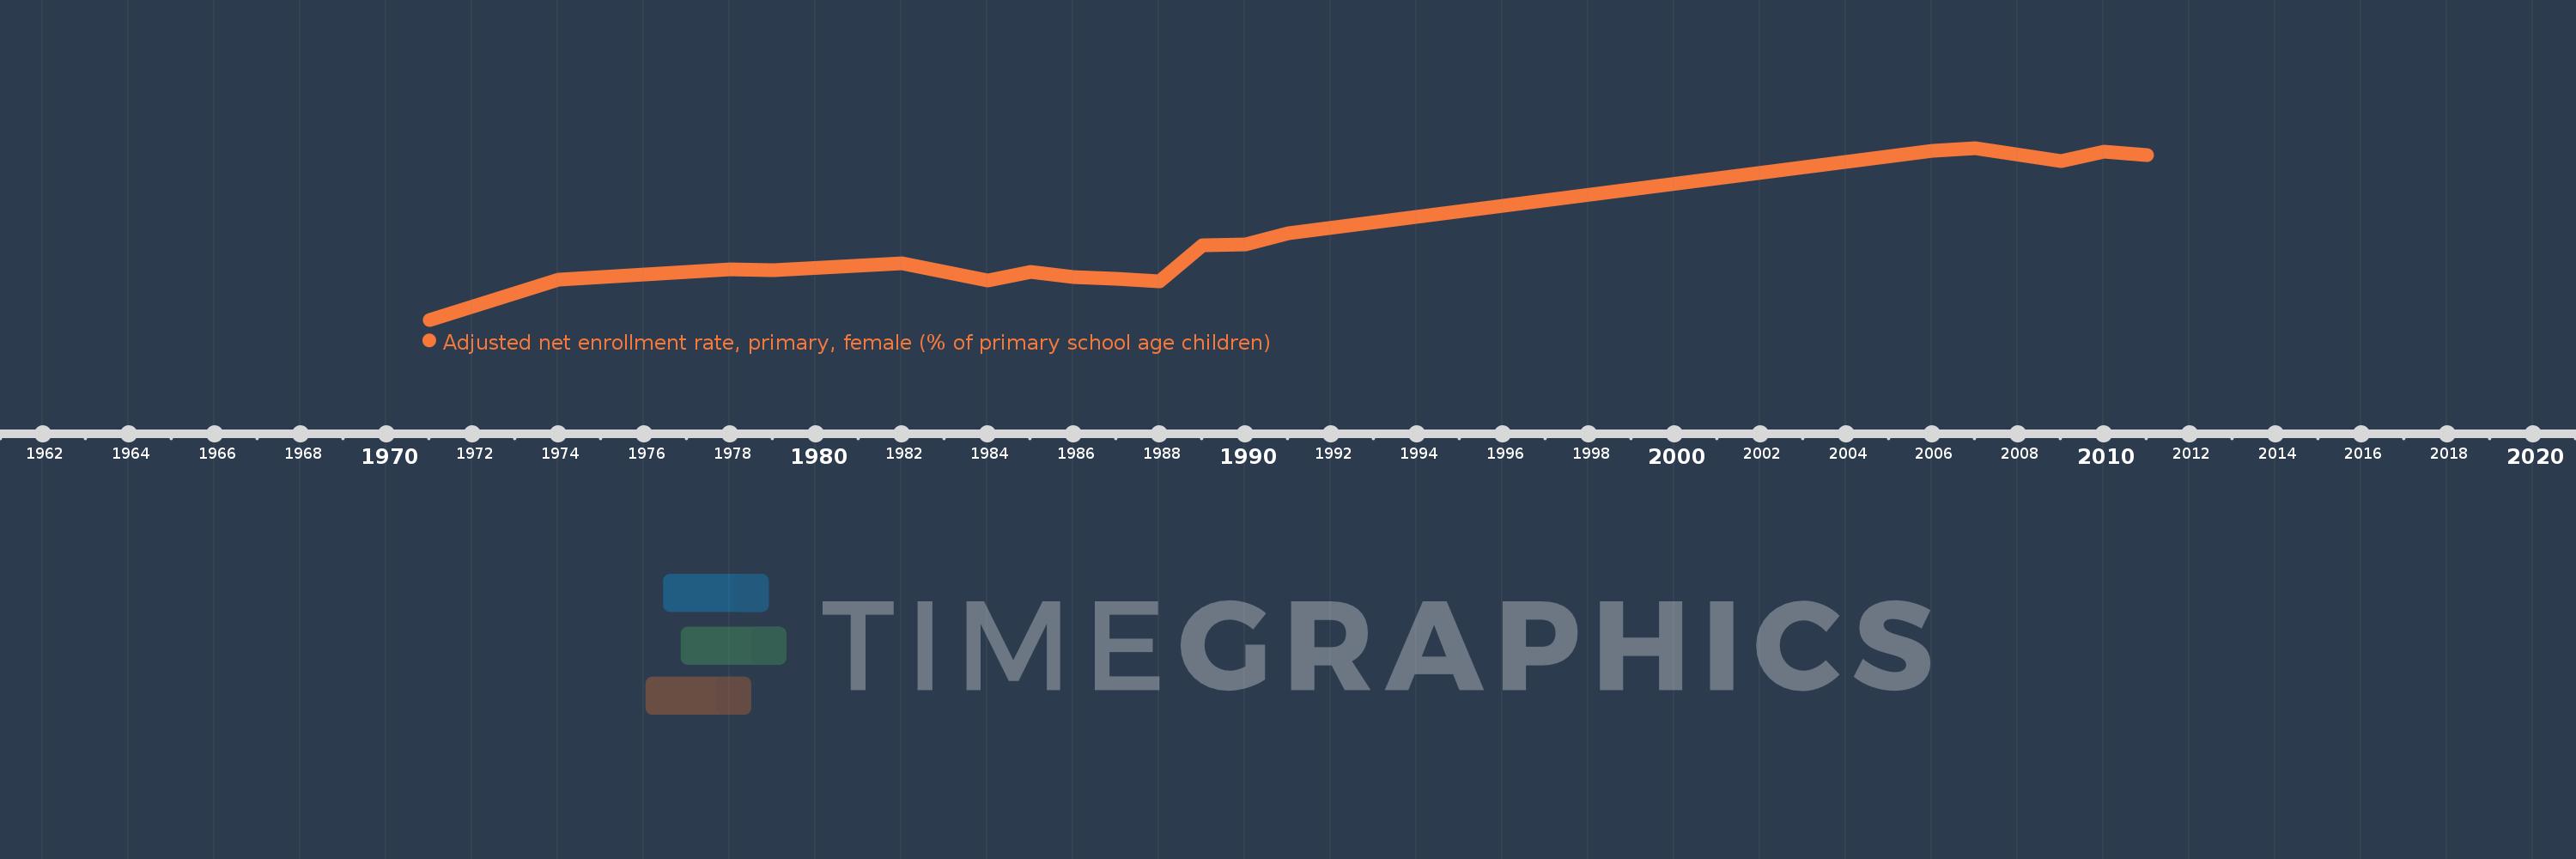
Adjusted net enrollment rate, primary, female (% of primary school age children)
2011,2010,2009,2007,2006,1991,1990,1989,1988,1987,1986,1985,1984,1982,1979,1978,1974,1971
