29
/pt/
pt
AIzaSyAYiBZKx7MnpbEhh9jyipgxe19OcubqV5w
April 1, 2024
116571
Cyprus
CYP
true
2
1
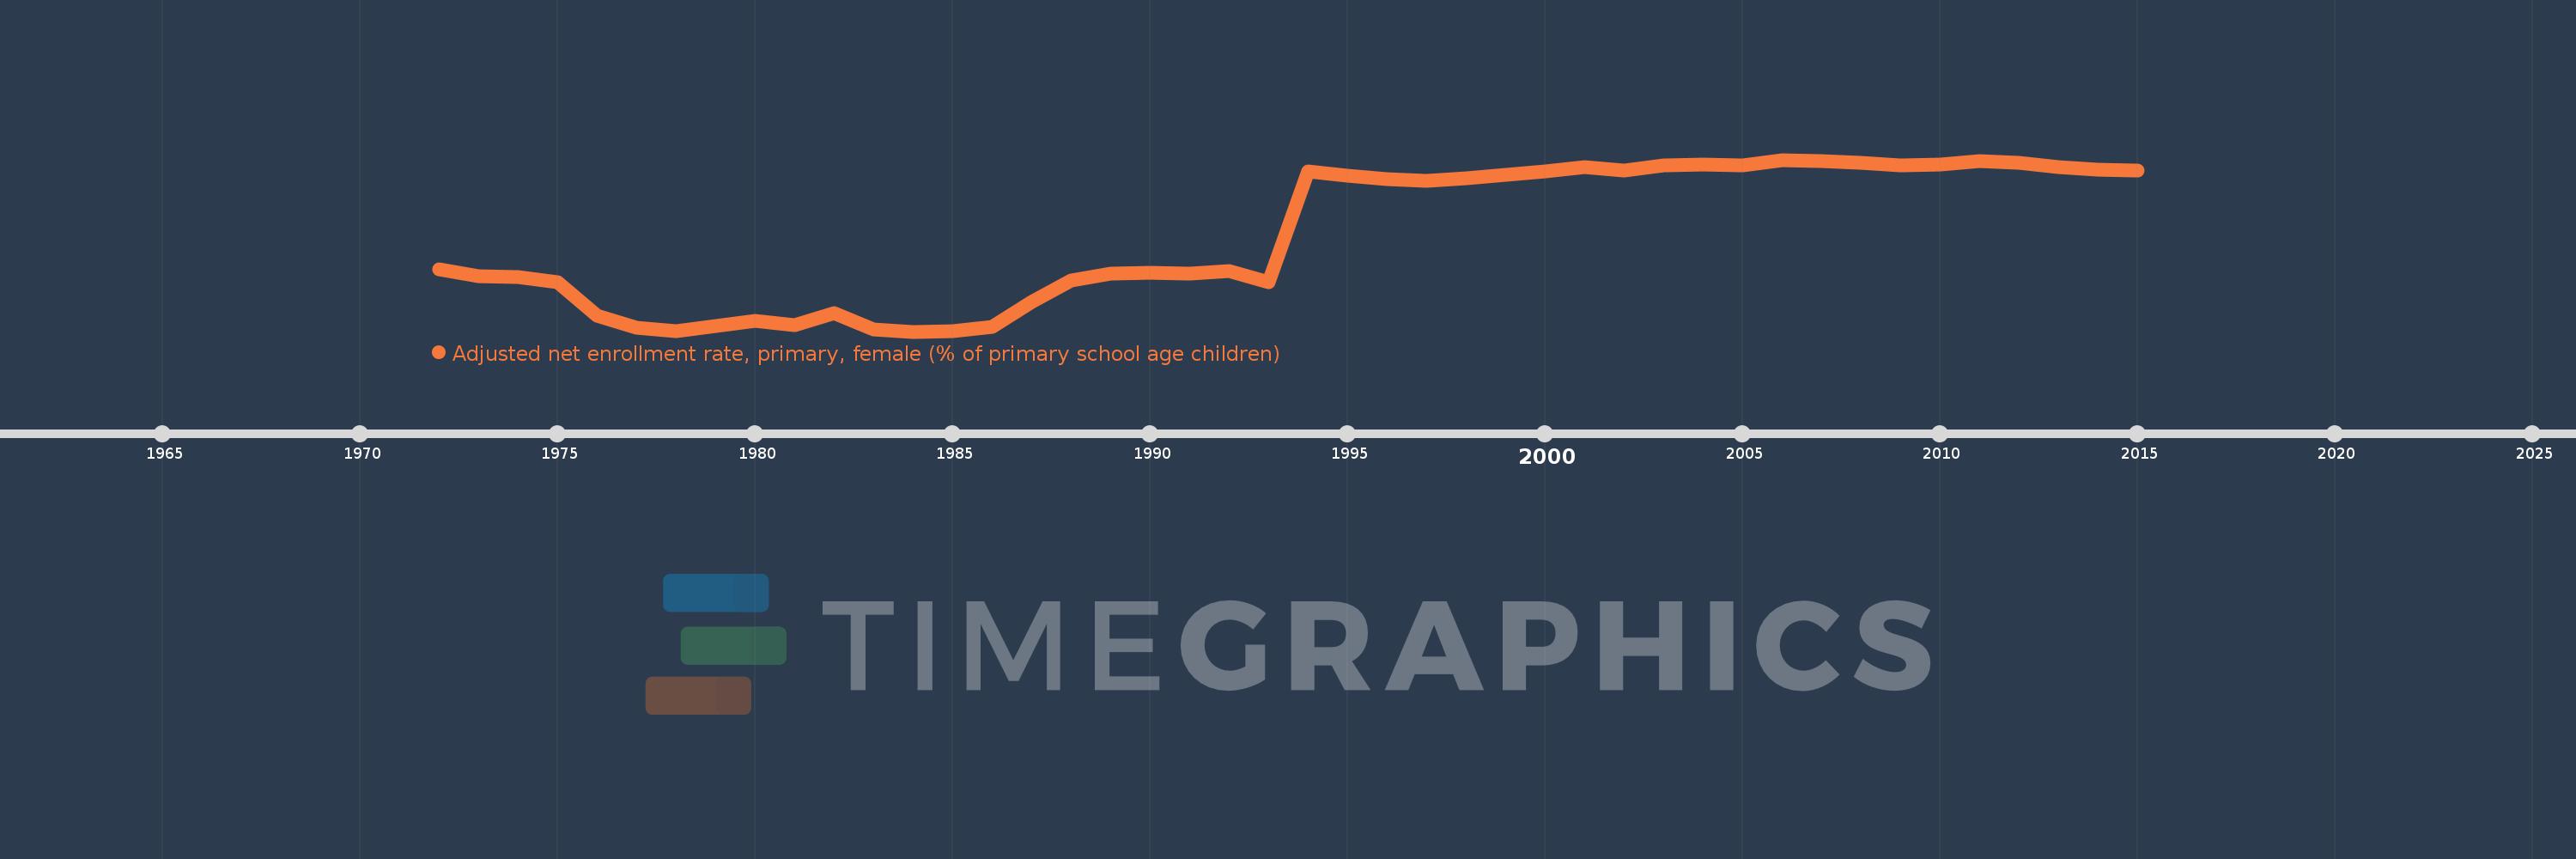
Adjusted net enrollment rate, primary, female (% of primary school age children)
2015,2014,2013,2012,2011,2010,2009,2008,2007,2006,2005,2004,2003,2002,2001,2000,1998,1997,1996,1995,1994,1993,1992,1991,1990,1989,1988,1987,1986,1985,1984,1983,1982,1981,1980,1979,1978,1977,1976,1975,1974,1973,1972
Estas estatísticas em outros países:
AfghanistanAlbaniaAlgeriaAngolaAntigua and BarbudaArab WorldArgentinaArmeniaArubaAustraliaAustriaAzerbaijanBahamas, TheBahrainBangladeshBarbadosBelarusBelgiumBelizeBeninBermudaBhutanBoliviaBosnia and HerzegovinaBotswanaBrazilBrunei DarussalamBulgariaBurkina FasoBurundiCabo VerdeCambodiaCameroonCanadaCaribbean small statesCentral African RepublicCentral Europe and the BalticsChadChileChinaColombiaComorosCongo, Dem. Rep.Congo, Rep.Costa RicaCote d'IvoireCroatiaCubaCyprusDenmarkDjiboutiDominicaDominican RepublicEarly-demographic dividendEast Asia & PacificEast Asia & Pacific (excluding high income)East Asia & Pacific (IDA & IBRD countries)EcuadorEgypt, Arab Rep.El SalvadorEquatorial GuineaEritreaEstoniaEthiopiaEuro areaEurope & Central AsiaEurope & Central Asia (excluding high income)Europe & Central Asia (IDA & IBRD countries)European UnionFijiFinlandFragile and conflict affected situationsFranceGabonGambia, TheGeorgiaGhanaGreeceGrenadaGuatemalaGuineaGuinea-BissauGuyanaHaitiHeavily indebted poor countries (HIPC)High incomeHondurasHong Kong SAR, ChinaHungaryIBRD onlyIcelandIDA & IBRD totalIDA blendIDA onlyIDA totalIndiaIndonesiaIran, Islamic Rep.IraqIrelandIsraelItalyJamaicaJapanJordanKazakhstanKenyaKiribatiKorea, Dem. People’s Rep.Korea, Rep.KuwaitKyrgyz RepublicLao PDRLate-demographic dividendLatin America & Caribbean Latin America & Caribbean (excluding high income)Latin America & the Caribbean (IDA & IBRD countries)LatviaLeast developed countries: UN classificationLebanonLesothoLiberiaLibyaLiechtensteinLithuaniaLow & middle incomeLow incomeLower middle incomeLuxembourgMacao SAR, ChinaMacedonia, FYRMadagascarMalawiMaldivesMaliMaltaMarshall IslandsMauritaniaMauritiusMexicoMicronesia, Fed. Sts.Middle East & North AfricaMiddle East & North Africa (excluding high income)Middle East & North Africa (IDA & IBRD countries)Middle incomeMoldovaMongoliaMontenegroMoroccoMozambiqueMyanmarNamibiaNauruNepalNetherlandsNew ZealandNicaraguaNigerNigeriaNorth AmericaNorwayOECD membersOmanOther small statesPacific island small statesPakistanPanamaPapua New GuineaParaguayPeruPhilippinesPolandPortugalPost-demographic dividendPre-demographic dividendPuerto RicoQatarRomaniaRussian FederationRwandaSamoaSan MarinoSao Tome and PrincipeSaudi ArabiaSenegalSerbiaSeychellesSierra LeoneSloveniaSmall statesSolomon IslandsSomaliaSouth AfricaSouth AsiaSouth Asia (IDA & IBRD)South SudanSpainSri LankaSt. Kitts and NevisSt. LuciaSt. Vincent and the GrenadinesSub-Saharan Africa Sub-Saharan Africa (excluding high income)Sub-Saharan Africa (IDA & IBRD countries)SudanSurinameSwazilandSwedenSwitzerlandSyrian Arab RepublicTajikistanTanzaniaThailandTimor-LesteTogoTongaTrinidad and TobagoTunisiaTurkeyTuvaluUgandaUkraineUnited Arab EmiratesUnited KingdomUnited StatesUpper middle incomeUruguayUzbekistanVanuatuVenezuela, RBWest Bank and GazaWorldYemen, Rep.ZambiaZimbabwe Linha do tempo:
Nesta escala de tempo está apresentado um gráfico de 1972 ano até 2015 ano Cyprus. Dados de 1971 ano ausente. O número de observações reais por data: 43.
Fonte (nome):
Indicadores de desenvolvimento mundial
Fonte (organização):
United Nations Educational, Scientific, and Cultural Organization (UNESCO) Institute for Statistics.
Categorias:
Education, Gender
Foi atualizado:
23 abr 2017 ano
Indicadores de alterações dos valores ao longo dos anos
Mínimo:
68.055
1 jan 1984 ano
Máximo:
99.746
1 jan 2006 ano
Na data de observação
Valor
Mudança absoluta
A alteração em relação ao valor anterior
1 jan 1972 ano
79.569
+79.569
0.0%
1 jan 1973 ano
78.215
-1.354
-1.7%
1 jan 1974 ano
78.044
-0.171
-0.22%
1 jan 1975 ano
77.09
-0.954
-1.22%
1 jan 1976 ano
70.991
-6.1
-7.91%
1 jan 1977 ano
68.78
-2.211
-3.11%
1 jan 1978 ano
68.112
-0.668
-0.97%
1 jan 1979 ano
69.019
+0.907
1.33%
1 jan 1980 ano
70.0
+0.981
1.42%
1 jan 1981 ano
69.215
-0.784
-1.12%
1 jan 1982 ano
71.518
+2.303
3.33%
1 jan 1983 ano
68.433
-3.085
-4.31%
1 jan 1984 ano
68.055
-0.378
-0.55%
1 jan 1985 ano
68.097
+0.042
0.06%
1 jan 1986 ano
68.95
+0.853
1.25%
1 jan 1987 ano
73.505
+4.555
6.61%
1 jan 1988 ano
77.484
+3.979
5.41%
1 jan 1989 ano
78.76
+1.276
1.65%
1 jan 1990 ano
78.955
+0.195
0.25%
1 jan 1991 ano
78.78
-0.174
-0.22%
1 jan 1992 ano
79.151
+0.37
0.47%
1 jan 1993 ano
77.195
-1.956
-2.47%
1 jan 1994 ano
97.669
+20.474
26.52%
1 jan 1995 ano
96.779
-0.89
-0.91%
1 jan 1996 ano
96.131
-0.648
-0.67%
1 jan 1997 ano
95.857
-0.274
-0.29%
1 jan 1998 ano
96.376
+0.519
0.54%
1 jan 2000 ano
97.584
+1.208
1.25%
1 jan 2001 ano
98.405
+0.821
0.84%
1 jan 2002 ano
97.817
-0.588
-0.6%
1 jan 2003 ano
98.781
+0.964
0.99%
1 jan 2004 ano
98.82
+0.039
0.04%
1 jan 2005 ano
98.694
-0.125
-0.13%
1 jan 2006 ano
99.746
+1.052
1.07%
1 jan 2007 ano
99.517
-0.229
-0.23%
1 jan 2008 ano
99.242
-0.275
-0.28%
1 jan 2009 ano
98.67
-0.572
-0.58%
1 jan 2010 ano
98.847
+0.177
0.18%
1 jan 2011 ano
99.465
+0.618
0.63%
1 jan 2012 ano
99.243
-0.222
-0.22%
1 jan 2013 ano
98.346
-0.897
-0.9%
1 jan 2014 ano
97.933
-0.413
-0.42%
1 jan 2015 ano
97.793
-0.14
-0.14%
Classificação de países por estatísticas atuais por anos


Comentários: