29
/pt/
pt
AIzaSyAYiBZKx7MnpbEhh9jyipgxe19OcubqV5w
April 1, 2024
77711
Bahrain
BHR
true
2
1
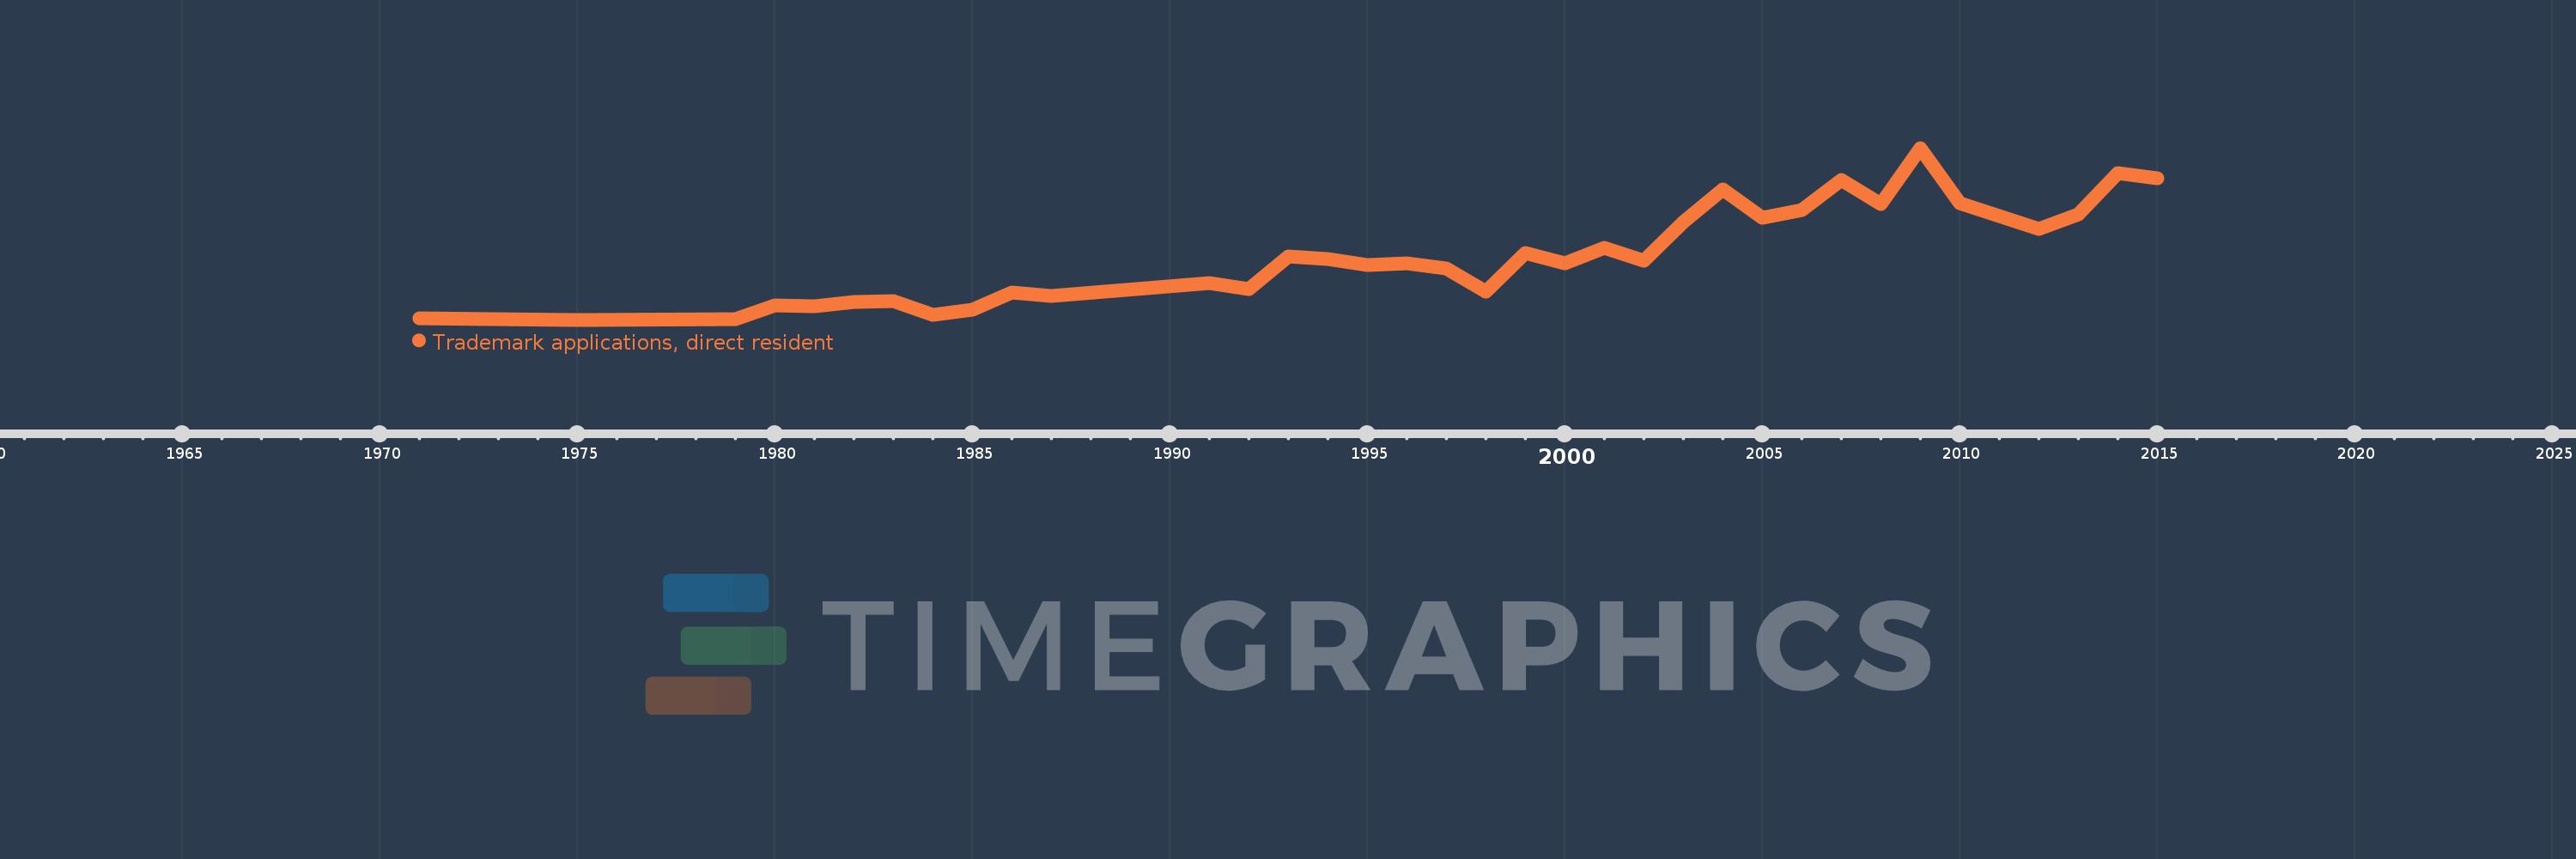
Trademark applications, direct resident
2015,2014,2013,2012,2010,2009,2008,2007,2006,2005,2004,2003,2002,2001,2000,1999,1998,1997,1996,1995,1994,1993,1992,1991,1987,1986,1985,1984,1983,1982,1981,1980,1979,1975,1971
Estas estatísticas em outros países:
AlbaniaAlgeriaAndorraAngolaArab WorldArgentinaArmeniaArubaAustraliaAustriaAzerbaijanBahamas, TheBahrainBangladeshBarbadosBelarusBelgiumBelizeBhutanBoliviaBosnia and HerzegovinaBotswanaBrazilBrunei DarussalamBulgariaBurkina FasoBurundiCabo VerdeCambodiaCanadaCaribbean small statesCentral Europe and the BalticsChileChinaColombiaCongo, Dem. Rep.Costa RicaCroatiaCubaCuracaoCyprusCzech RepublicDenmarkDjiboutiDominicaDominican RepublicEarly-demographic dividendEast Asia & PacificEast Asia & Pacific (excluding high income)East Asia & Pacific (IDA & IBRD countries)EcuadorEgypt, Arab Rep.El SalvadorEstoniaEthiopiaEuro areaEurope & Central AsiaEurope & Central Asia (excluding high income)Europe & Central Asia (IDA & IBRD countries)European UnionFijiFinlandFranceGambia, TheGeorgiaGermanyGhanaGreeceGrenadaGuatemalaGuineaGuinea-BissauGuyanaHaitiHigh incomeHondurasHong Kong SAR, ChinaHungaryIBRD onlyIcelandIDA & IBRD totalIDA blendIndiaIndonesiaIran, Islamic Rep.IraqIrelandIsraelItalyJamaicaJapanJordanKazakhstanKenyaKorea, Dem. People’s Rep.Korea, Rep.KuwaitKyrgyz RepublicLao PDRLate-demographic dividendLatin America & Caribbean Latin America & Caribbean (excluding high income)Latin America & the Caribbean (IDA & IBRD countries)LatviaLebanonLesothoLiberiaLibyaLiechtensteinLithuaniaLow & middle incomeLower middle incomeLuxembourgMacao SAR, ChinaMacedonia, FYRMadagascarMalawiMalaysiaMaldivesMaliMaltaMauritiusMexicoMiddle East & North AfricaMiddle East & North Africa (excluding high income)Middle East & North Africa (IDA & IBRD countries)Middle incomeMoldovaMonacoMongoliaMontenegroMoroccoMozambiqueMyanmarNamibiaNepalNetherlandsNew ZealandNicaraguaNigeriaNorth AmericaNorwayOECD membersOmanPakistanPanamaPapua New GuineaParaguayPeruPhilippinesPolandPortugalPost-demographic dividendQatarRomaniaRussian FederationRwandaSamoaSan MarinoSao Tome and PrincipeSaudi ArabiaSerbiaSeychellesSierra LeoneSingaporeSlovak RepublicSloveniaSomaliaSouth AfricaSouth AsiaSouth Asia (IDA & IBRD)SpainSri LankaSt. LuciaSt. Vincent and the GrenadinesSudanSurinameSwazilandSwedenSwitzerlandSyrian Arab RepublicTajikistanTanzaniaThailandTongaTrinidad and TobagoTunisiaTurkeyTurkmenistanUgandaUkraineUnited Arab EmiratesUnited KingdomUnited StatesUpper middle incomeUruguayUzbekistanVenezuela, RBVietnamWorldYemen, Rep.ZambiaZimbabwe Linha do tempo:
Nesta escala de tempo está apresentado um gráfico de 1971 ano até 2015 ano Bahrain. Dados de 1970 ano ausente. O número de observações reais por data: 35.
Fonte (nome):
Indicadores de desenvolvimento mundial
Fonte (organização):
World Intellectual Property Organization (WIPO), WIPO Patent Report: Statistics on Worldwide Patent Activity. The International Bureau of WIPO assumes no responsibility with respect to the transformation of these data.
Categorias:
Science & Technology
Foi atualizado:
23 abr 2017 ano
Indicadores de alterações dos valores ao longo dos anos
Máximo:
503.0
1 jan 2009 ano
Na data de observação
Valor
Mudança absoluta
A alteração em relação ao valor anterior
1 jan 1971 ano
10.0
+10.0
0.0%
1 jan 1975 ano
6.0
-4.0
-40.0%
1 jan 1979 ano
7.0
+1.0
16.67%
1 jan 1980 ano
48.0
+41.0
585.71%
1 jan 1981 ano
46.0
-2.0
-4.17%
1 jan 1982 ano
58.0
+12.0
26.09%
1 jan 1983 ano
61.0
+3.0
5.17%
1 jan 1984 ano
20.0
-41.0
-67.21%
1 jan 1985 ano
36.0
+16.0
80.0%
1 jan 1986 ano
86.0
+50.0
138.89%
1 jan 1987 ano
74.0
-12.0
-13.95%
1 jan 1991 ano
112.0
+38.0
51.35%
1 jan 1992 ano
95.0
-17.0
-15.18%
1 jan 1993 ano
189.0
+94.0
98.95%
1 jan 1994 ano
182.0
-7.0
-3.7%
1 jan 1995 ano
164.0
-18.0
-9.89%
1 jan 1996 ano
170.0
+6.0
3.66%
1 jan 1997 ano
154.0
-16.0
-9.41%
1 jan 1998 ano
87.0
-67.0
-43.51%
1 jan 1999 ano
198.0
+111.0
127.59%
1 jan 2000 ano
169.0
-29.0
-14.65%
1 jan 2001 ano
215.0
+46.0
27.22%
1 jan 2002 ano
177.0
-38.0
-17.67%
1 jan 2003 ano
289.0
+112.0
63.28%
1 jan 2004 ano
382.0
+93.0
32.18%
1 jan 2005 ano
300.0
-82.0
-21.47%
1 jan 2006 ano
323.0
+23.0
7.67%
1 jan 2007 ano
411.0
+88.0
27.24%
1 jan 2008 ano
340.0
-71.0
-17.27%
1 jan 2009 ano
503.0
+163.0
47.94%
1 jan 2010 ano
343.0
-160.0
-31.81%
1 jan 2012 ano
269.0
-74.0
-21.57%
1 jan 2013 ano
310.0
+41.0
15.24%
1 jan 2014 ano
429.0
+119.0
38.39%
1 jan 2015 ano
415.0
-14.0
-3.26%
Classificação de países por estatísticas atuais por anos


Comentários: