29
/pt/
pt
AIzaSyAYiBZKx7MnpbEhh9jyipgxe19OcubqV5w
April 1, 2024
198646
Monaco
MCO
true
2
1
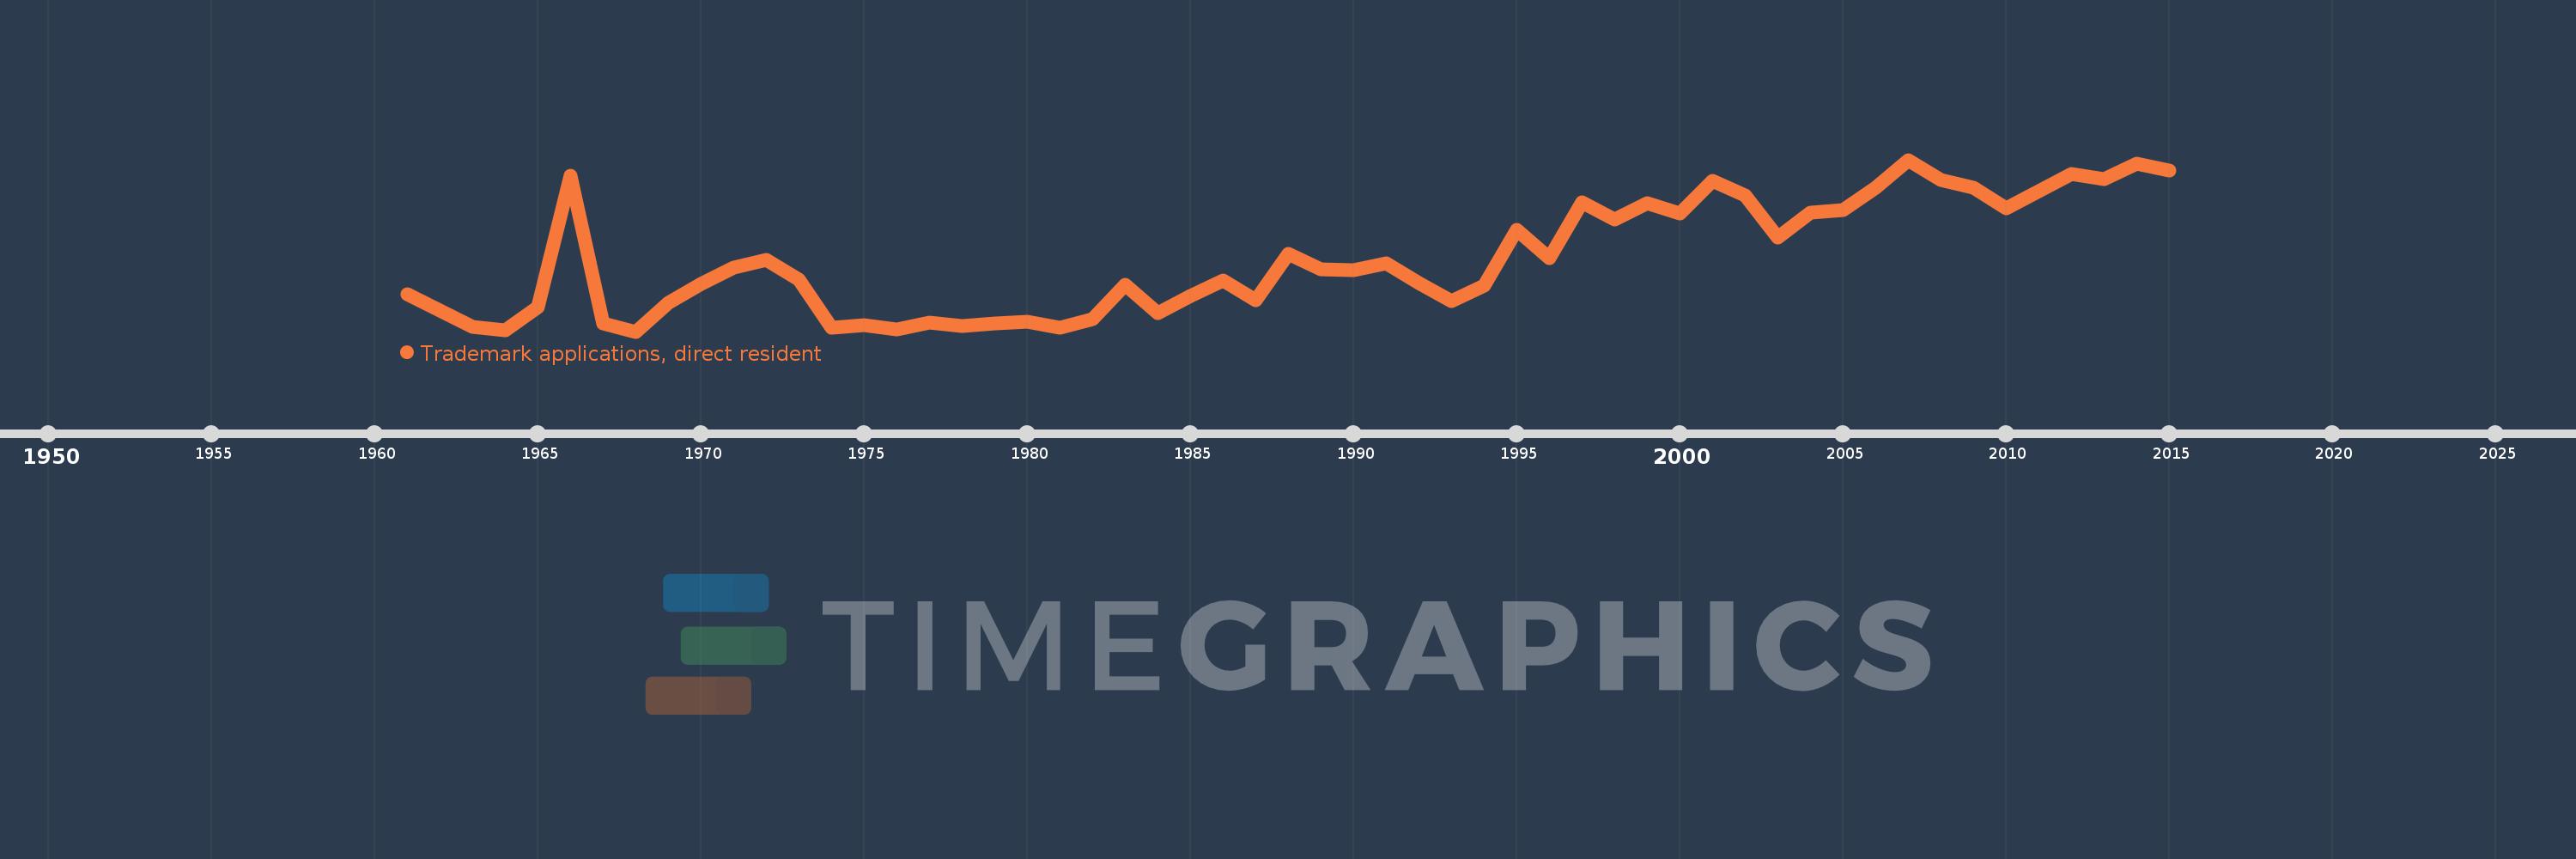
Trademark applications, direct resident
2015,2014,2013,2012,2010,2009,2008,2007,2006,2005,2004,2003,2002,2001,2000,1999,1998,1997,1996,1995,1994,1993,1992,1991,1990,1989,1988,1987,1986,1985,1984,1983,1982,1981,1980,1979,1978,1977,1976,1975,1974,1973,1972,1971,1970,1969,1968,1967,1966,1965,1964,1963,1961
Estas estatísticas em outros países:
AlbaniaAlgeriaAndorraAngolaArab WorldArgentinaArmeniaArubaAustraliaAustriaAzerbaijanBahamas, TheBahrainBangladeshBarbadosBelarusBelgiumBelizeBhutanBoliviaBosnia and HerzegovinaBotswanaBrazilBrunei DarussalamBulgariaBurkina FasoBurundiCabo VerdeCambodiaCanadaCaribbean small statesCentral Europe and the BalticsChileChinaColombiaCongo, Dem. Rep.Costa RicaCroatiaCubaCuracaoCyprusCzech RepublicDenmarkDjiboutiDominicaDominican RepublicEarly-demographic dividendEast Asia & PacificEast Asia & Pacific (excluding high income)East Asia & Pacific (IDA & IBRD countries)EcuadorEgypt, Arab Rep.El SalvadorEstoniaEthiopiaEuro areaEurope & Central AsiaEurope & Central Asia (excluding high income)Europe & Central Asia (IDA & IBRD countries)European UnionFijiFinlandFranceGambia, TheGeorgiaGermanyGhanaGreeceGrenadaGuatemalaGuineaGuinea-BissauGuyanaHaitiHigh incomeHondurasHong Kong SAR, ChinaHungaryIBRD onlyIcelandIDA & IBRD totalIDA blendIndiaIndonesiaIran, Islamic Rep.IraqIrelandIsraelItalyJamaicaJapanJordanKazakhstanKenyaKorea, Dem. People’s Rep.Korea, Rep.KuwaitKyrgyz RepublicLao PDRLate-demographic dividendLatin America & Caribbean Latin America & Caribbean (excluding high income)Latin America & the Caribbean (IDA & IBRD countries)LatviaLebanonLesothoLiberiaLibyaLiechtensteinLithuaniaLow & middle incomeLower middle incomeLuxembourgMacao SAR, ChinaMacedonia, FYRMadagascarMalawiMalaysiaMaldivesMaliMaltaMauritiusMexicoMiddle East & North AfricaMiddle East & North Africa (excluding high income)Middle East & North Africa (IDA & IBRD countries)Middle incomeMoldovaMonacoMongoliaMontenegroMoroccoMozambiqueMyanmarNamibiaNepalNetherlandsNew ZealandNicaraguaNigeriaNorth AmericaNorwayOECD membersOmanPakistanPanamaPapua New GuineaParaguayPeruPhilippinesPolandPortugalPost-demographic dividendQatarRomaniaRussian FederationRwandaSamoaSan MarinoSao Tome and PrincipeSaudi ArabiaSerbiaSeychellesSierra LeoneSingaporeSlovak RepublicSloveniaSomaliaSouth AfricaSouth AsiaSouth Asia (IDA & IBRD)SpainSri LankaSt. LuciaSt. Vincent and the GrenadinesSudanSurinameSwazilandSwedenSwitzerlandSyrian Arab RepublicTajikistanTanzaniaThailandTongaTrinidad and TobagoTunisiaTurkeyTurkmenistanUgandaUkraineUnited Arab EmiratesUnited KingdomUnited StatesUpper middle incomeUruguayUzbekistanVenezuela, RBVietnamWorldYemen, Rep.ZambiaZimbabwe Linha do tempo:
Nesta escala de tempo está apresentado um gráfico de 1961 ano até 2015 ano Monaco. Dados de 1960 ano ausente. O número de observações reais por data: 53.
Fonte (nome):
Indicadores de desenvolvimento mundial
Fonte (organização):
World Intellectual Property Organization (WIPO), WIPO Patent Report: Statistics on Worldwide Patent Activity. The International Bureau of WIPO assumes no responsibility with respect to the transformation of these data.
Categorias:
Science & Technology
Foi atualizado:
23 abr 2017 ano
Indicadores de alterações dos valores ao longo dos anos
Mínimo:
43.0
1 jan 1968 ano
Máximo:
420.0
1 jan 2007 ano
Na data de observação
Valor
Mudança absoluta
A alteração em relação ao valor anterior
1 jan 1961 ano
125.0
+125.0
0.0%
1 jan 1963 ano
54.0
-71.0
-56.8%
1 jan 1964 ano
45.0
-9.0
-16.67%
1 jan 1965 ano
97.0
+52.0
115.56%
1 jan 1966 ano
386.0
+289.0
297.94%
1 jan 1967 ano
61.0
-325.0
-84.2%
1 jan 1968 ano
43.0
-18.0
-29.51%
1 jan 1969 ano
107.0
+64.0
148.84%
1 jan 1970 ano
148.0
+41.0
38.32%
1 jan 1971 ano
184.0
+36.0
24.32%
1 jan 1972 ano
200.0
+16.0
8.7%
1 jan 1973 ano
157.0
-43.0
-21.5%
1 jan 1974 ano
51.0
-106.0
-67.52%
1 jan 1975 ano
58.0
+7.0
13.73%
1 jan 1976 ano
48.0
-10.0
-17.24%
1 jan 1977 ano
63.0
+15.0
31.25%
1 jan 1978 ano
56.0
-7.0
-11.11%
1 jan 1979 ano
60.0
+4.0
7.14%
1 jan 1980 ano
65.0
+5.0
8.33%
1 jan 1981 ano
51.0
-14.0
-21.54%
1 jan 1982 ano
71.0
+20.0
39.22%
1 jan 1983 ano
146.0
+75.0
105.63%
1 jan 1984 ano
83.0
-63.0
-43.15%
1 jan 1985 ano
122.0
+39.0
46.99%
1 jan 1986 ano
155.0
+33.0
27.05%
1 jan 1987 ano
111.0
-44.0
-28.39%
1 jan 1988 ano
214.0
+103.0
92.79%
1 jan 1989 ano
180.0
-34.0
-15.89%
1 jan 1990 ano
178.0
-2.0
-1.11%
1 jan 1991 ano
193.0
+15.0
8.43%
1 jan 1992 ano
149.0
-44.0
-22.8%
1 jan 1993 ano
110.0
-39.0
-26.17%
1 jan 1994 ano
143.0
+33.0
30.0%
1 jan 1995 ano
267.0
+124.0
86.71%
1 jan 1996 ano
204.0
-63.0
-23.6%
1 jan 1997 ano
326.0
+122.0
59.8%
1 jan 1998 ano
289.0
-37.0
-11.35%
1 jan 1999 ano
324.0
+35.0
12.11%
1 jan 2000 ano
302.0
-22.0
-6.79%
1 jan 2001 ano
374.0
+72.0
23.84%
1 jan 2002 ano
341.0
-33.0
-8.82%
1 jan 2003 ano
250.0
-91.0
-26.69%
1 jan 2004 ano
305.0
+55.0
22.0%
1 jan 2005 ano
310.0
+5.0
1.64%
1 jan 2006 ano
359.0
+49.0
15.81%
1 jan 2007 ano
420.0
+61.0
16.99%
1 jan 2008 ano
376.0
-44.0
-10.48%
1 jan 2009 ano
358.0
-18.0
-4.79%
1 jan 2010 ano
313.0
-45.0
-12.57%
1 jan 2012 ano
388.0
+75.0
23.96%
1 jan 2013 ano
377.0
-11.0
-2.84%
1 jan 2014 ano
412.0
+35.0
9.28%
1 jan 2015 ano
396.0
-16.0
-3.88%
Classificação de países por estatísticas atuais por anos


Comentários: