29
/pt/
pt
AIzaSyAYiBZKx7MnpbEhh9jyipgxe19OcubqV5w
April 1, 2024
76756
Bahamas, The
BHS
true
2
1
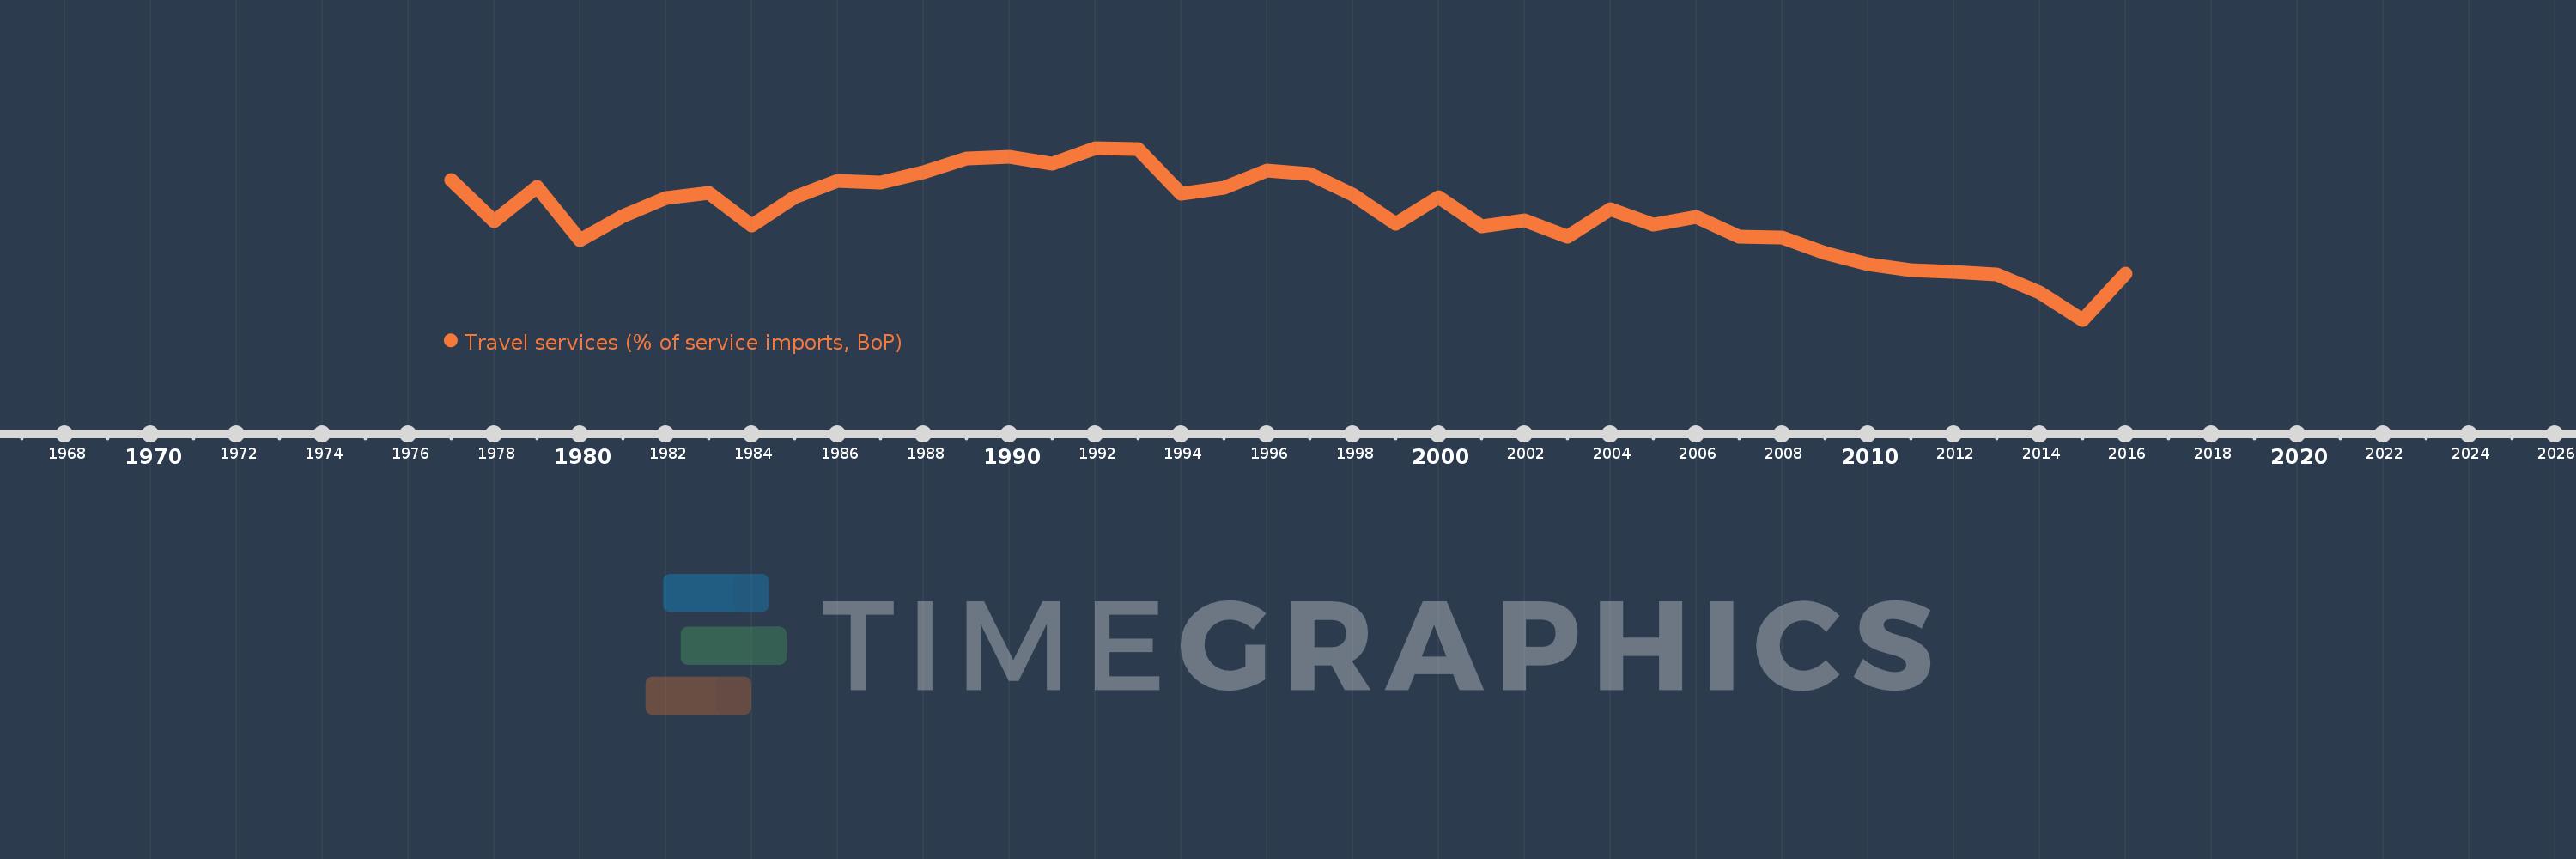
Travel services (% of service imports, BoP)
2016,2015,2014,2013,2012,2011,2010,2009,2008,2007,2006,2005,2004,2003,2002,2001,2000,1999,1998,1997,1996,1995,1994,1993,1992,1991,1990,1989,1988,1987,1986,1985,1984,1983,1982,1981,1980,1979,1978,1977
Estas estatísticas em outros países:
AfghanistanAlbaniaAlgeriaAngolaAntigua and BarbudaArab WorldArgentinaArmeniaArubaAustraliaAustriaAzerbaijanBahamas, TheBahrainBangladeshBarbadosBelarusBelgiumBelizeBeninBermudaBhutanBoliviaBosnia and HerzegovinaBotswanaBrazilBrunei DarussalamBulgariaBurkina FasoBurundiCabo VerdeCambodiaCameroonCanadaCaribbean small statesCentral African RepublicCentral Europe and the BalticsChadChileChinaColombiaComorosCongo, Dem. Rep.Congo, Rep.Costa RicaCote d'IvoireCroatiaCuracaoCyprusCzech RepublicDenmarkDjiboutiDominicaDominican RepublicEarly-demographic dividendEast Asia & PacificEast Asia & Pacific (excluding high income)East Asia & Pacific (IDA & IBRD countries)EcuadorEgypt, Arab Rep.El SalvadorEritreaEstoniaEthiopiaEuro areaEurope & Central AsiaEurope & Central Asia (excluding high income)Europe & Central Asia (IDA & IBRD countries)European UnionFaroe IslandsFijiFinlandFragile and conflict affected situationsFranceFrench PolynesiaGabonGambia, TheGeorgiaGermanyGhanaGreeceGrenadaGuatemalaGuineaGuinea-BissauGuyanaHaitiHeavily indebted poor countries (HIPC)High incomeHondurasHong Kong SAR, ChinaHungaryIBRD onlyIcelandIDA & IBRD totalIDA onlyIDA totalIndiaIndonesiaIran, Islamic Rep.IraqIrelandIsraelItalyJamaicaJapanJordanKazakhstanKenyaKiribatiKorea, Rep.KosovoKuwaitKyrgyz RepublicLao PDRLate-demographic dividendLatin America & Caribbean Latin America & Caribbean (excluding high income)Latin America & the Caribbean (IDA & IBRD countries)LatviaLeast developed countries: UN classificationLebanonLesothoLiberiaLibyaLithuaniaLow & middle incomeLow incomeLower middle incomeLuxembourgMacao SAR, ChinaMacedonia, FYRMadagascarMalawiMalaysiaMaldivesMaliMaltaMarshall IslandsMauritaniaMauritiusMexicoMicronesia, Fed. Sts.Middle East & North AfricaMiddle East & North Africa (excluding high income)Middle East & North Africa (IDA & IBRD countries)Middle incomeMoldovaMongoliaMontenegroMoroccoMozambiqueMyanmarNamibiaNepalNetherlandsNew CaledoniaNew ZealandNicaraguaNigerNigeriaNorth AmericaNorwayOECD membersOmanOther small statesPacific island small statesPakistanPalauPanamaPapua New GuineaParaguayPeruPhilippinesPolandPortugalPost-demographic dividendPre-demographic dividendQatarRomaniaRussian FederationRwandaSamoaSao Tome and PrincipeSaudi ArabiaSenegalSerbiaSeychellesSierra LeoneSingaporeSint Maarten (Dutch part)Slovak RepublicSloveniaSmall statesSolomon IslandsSouth AfricaSouth AsiaSouth Asia (IDA & IBRD)South SudanSpainSri LankaSt. Kitts and NevisSt. LuciaSt. Vincent and the GrenadinesSub-Saharan Africa Sub-Saharan Africa (excluding high income)Sub-Saharan Africa (IDA & IBRD countries)SudanSurinameSwazilandSwedenSwitzerlandSyrian Arab RepublicTajikistanTanzaniaThailandTimor-LesteTogoTongaTrinidad and TobagoTunisiaTurkeyTuvaluUgandaUkraineUnited KingdomUnited StatesUpper middle incomeUruguayVanuatuVenezuela, RBWest Bank and GazaWorldYemen, Rep.ZambiaZimbabwe Linha do tempo:
Nesta escala de tempo está apresentado um gráfico de 1977 ano até 2016 ano Bahamas, The. Dados de 1976 ano ausente. O número de observações reais por data: 40.
Fonte (nome):
Indicadores de desenvolvimento mundial
Fonte (organização):
International Monetary Fund, Balance of Payments Statistics Yearbook and data files.
Categorias:
Economy & Growth, Trade
Foi atualizado:
23 abr 2017 ano
Indicadores de alterações dos valores ao longo dos anos
Mínimo:
12.263
1 jan 2015 ano
Máximo:
36.46
1 jan 1992 ano
Na data de observação
Valor
Mudança absoluta
A alteração em relação ao valor anterior
1 jan 1977 ano
31.901
+31.901
0.0%
1 jan 1978 ano
26.116
-5.785
-18.13%
1 jan 1979 ano
30.98
+4.864
18.62%
1 jan 1980 ano
23.529
-7.451
-24.05%
1 jan 1981 ano
26.811
+3.281
13.95%
1 jan 1982 ano
29.363
+2.552
9.52%
1 jan 1983 ano
30.136
+0.773
2.63%
1 jan 1984 ano
25.548
-4.587
-15.22%
1 jan 1985 ano
29.566
+4.018
15.73%
1 jan 1986 ano
31.865
+2.298
7.77%
1 jan 1987 ano
31.626
-0.239
-0.75%
1 jan 1988 ano
33.059
+1.434
4.53%
1 jan 1989 ano
34.935
+1.876
5.67%
1 jan 1990 ano
35.192
+0.257
0.73%
1 jan 1991 ano
34.276
-0.916
-2.6%
1 jan 1992 ano
36.46
+2.184
6.37%
1 jan 1993 ano
36.295
-0.165
-0.45%
1 jan 1994 ano
30.067
-6.228
-17.16%
1 jan 1995 ano
30.82
+0.753
2.5%
1 jan 1996 ano
33.297
+2.477
8.04%
1 jan 1997 ano
32.775
-0.522
-1.57%
1 jan 1998 ano
29.88
-2.894
-8.83%
1 jan 1999 ano
25.815
-4.065
-13.61%
1 jan 2000 ano
29.584
+3.769
14.6%
1 jan 2001 ano
25.435
-4.15
-14.03%
1 jan 2002 ano
26.254
+0.819
3.22%
1 jan 2003 ano
24.003
-2.251
-8.57%
1 jan 2004 ano
27.893
+3.891
16.21%
1 jan 2005 ano
25.631
-2.262
-8.11%
1 jan 2006 ano
26.764
+1.133
4.42%
1 jan 2007 ano
23.915
-2.849
-10.64%
1 jan 2008 ano
23.895
-0.02
-0.08%
1 jan 2009 ano
21.706
-2.189
-9.16%
1 jan 2010 ano
20.103
-1.602
-7.38%
1 jan 2011 ano
19.267
-0.837
-4.16%
1 jan 2012 ano
19.054
-0.213
-1.11%
1 jan 2013 ano
18.581
-0.473
-2.48%
1 jan 2014 ano
16.12
-2.461
-13.24%
1 jan 2015 ano
12.263
-3.857
-23.92%
1 jan 2016 ano
18.731
+6.468
52.74%
Classificação de países por estatísticas atuais por anos


Comentários: