29
/pt/
pt
AIzaSyAYiBZKx7MnpbEhh9jyipgxe19OcubqV5w
April 1, 2024
60477
Sub-Saharan Africa (excluding high income)
SSA
false
2
1
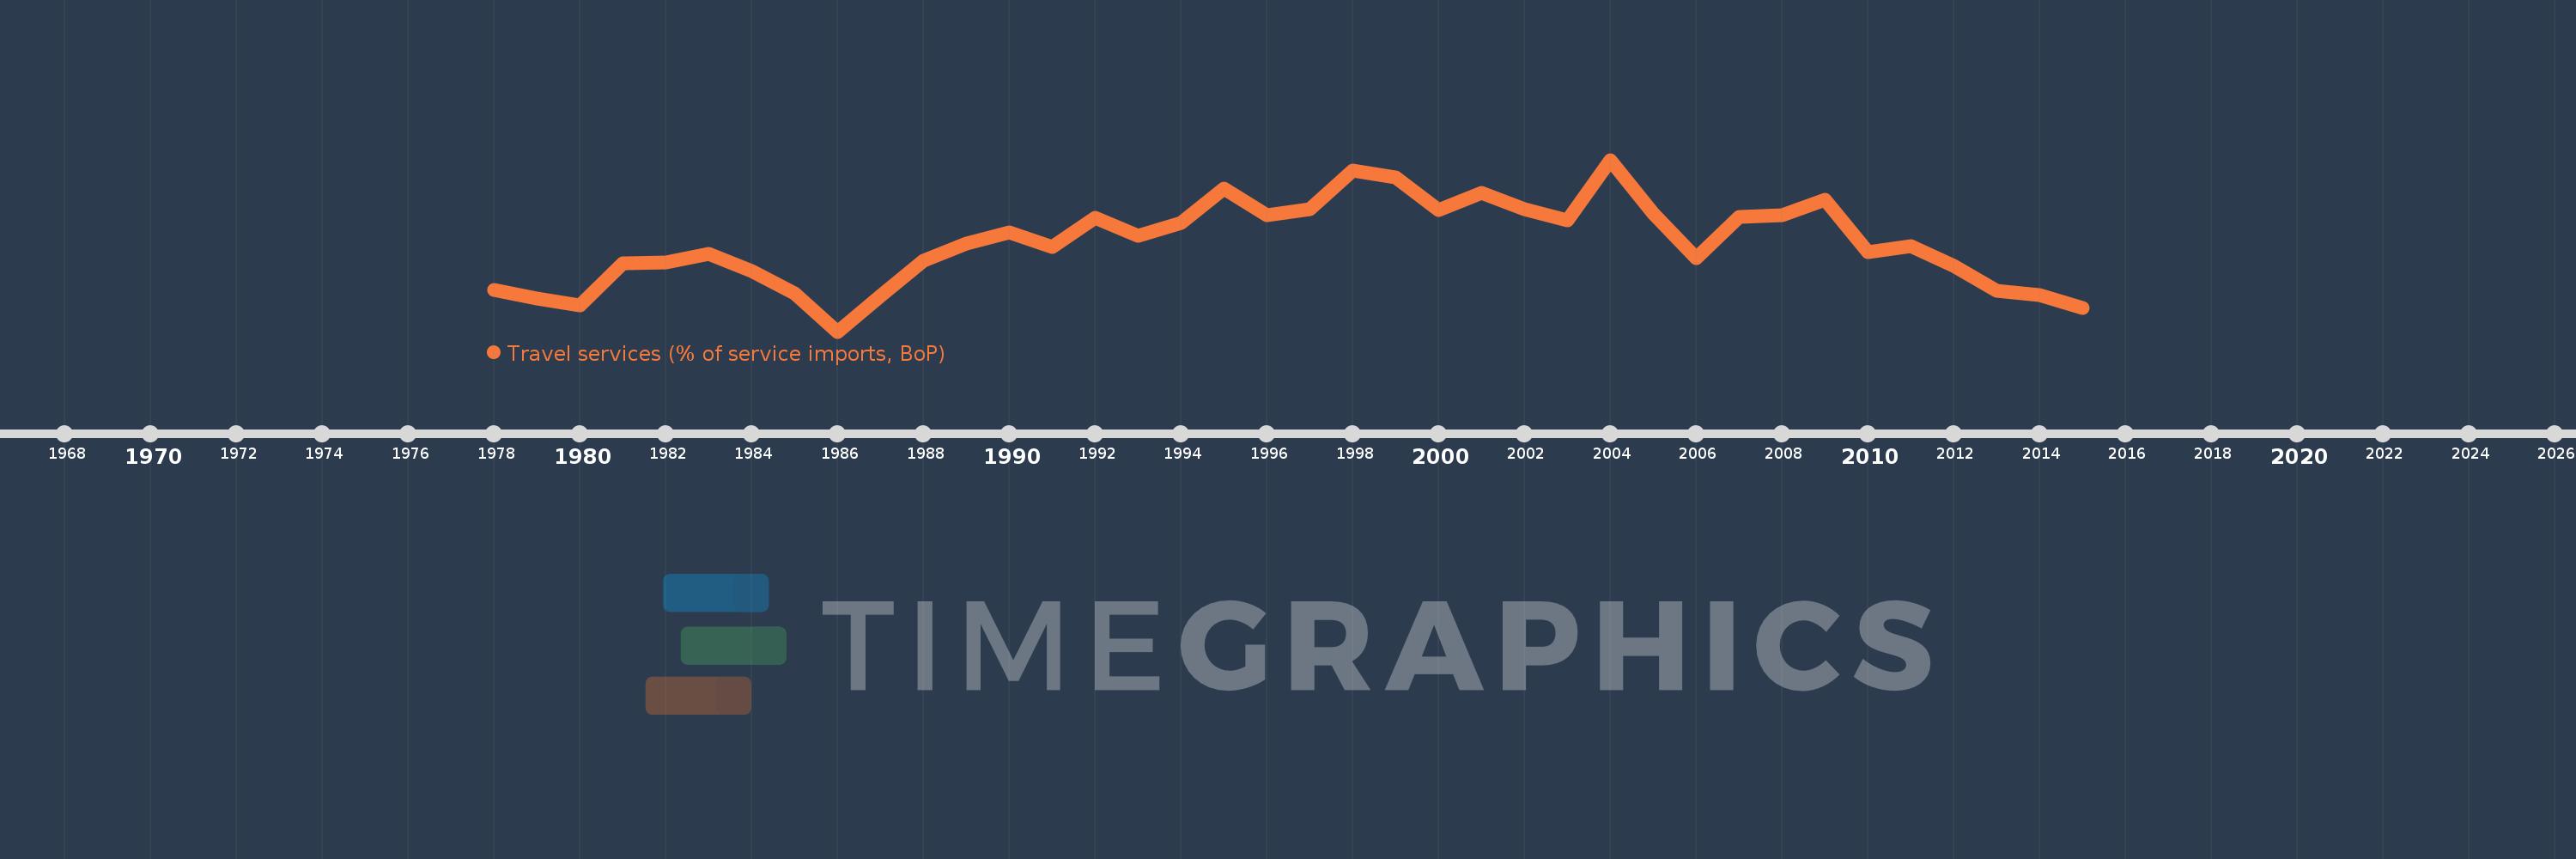
Travel services (% of service imports, BoP)
2015,2014,2013,2012,2011,2010,2009,2008,2007,2006,2005,2004,2003,2002,2001,2000,1999,1998,1997,1996,1995,1994,1993,1992,1991,1990,1989,1988,1987,1986,1985,1984,1983,1982,1981,1980,1979,1978
Estas estatísticas em outros países:
AfghanistanAlbaniaAlgeriaAngolaAntigua and BarbudaArab WorldArgentinaArmeniaArubaAustraliaAustriaAzerbaijanBahamas, TheBahrainBangladeshBarbadosBelarusBelgiumBelizeBeninBermudaBhutanBoliviaBosnia and HerzegovinaBotswanaBrazilBrunei DarussalamBulgariaBurkina FasoBurundiCabo VerdeCambodiaCameroonCanadaCaribbean small statesCentral African RepublicCentral Europe and the BalticsChadChileChinaColombiaComorosCongo, Dem. Rep.Congo, Rep.Costa RicaCote d'IvoireCroatiaCuracaoCyprusCzech RepublicDenmarkDjiboutiDominicaDominican RepublicEarly-demographic dividendEast Asia & PacificEast Asia & Pacific (excluding high income)East Asia & Pacific (IDA & IBRD countries)EcuadorEgypt, Arab Rep.El SalvadorEritreaEstoniaEthiopiaEuro areaEurope & Central AsiaEurope & Central Asia (excluding high income)Europe & Central Asia (IDA & IBRD countries)European UnionFaroe IslandsFijiFinlandFragile and conflict affected situationsFranceFrench PolynesiaGabonGambia, TheGeorgiaGermanyGhanaGreeceGrenadaGuatemalaGuineaGuinea-BissauGuyanaHaitiHeavily indebted poor countries (HIPC)High incomeHondurasHong Kong SAR, ChinaHungaryIBRD onlyIcelandIDA & IBRD totalIDA onlyIDA totalIndiaIndonesiaIran, Islamic Rep.IraqIrelandIsraelItalyJamaicaJapanJordanKazakhstanKenyaKiribatiKorea, Rep.KosovoKuwaitKyrgyz RepublicLao PDRLate-demographic dividendLatin America & Caribbean Latin America & Caribbean (excluding high income)Latin America & the Caribbean (IDA & IBRD countries)LatviaLeast developed countries: UN classificationLebanonLesothoLiberiaLibyaLithuaniaLow & middle incomeLow incomeLower middle incomeLuxembourgMacao SAR, ChinaMacedonia, FYRMadagascarMalawiMalaysiaMaldivesMaliMaltaMarshall IslandsMauritaniaMauritiusMexicoMicronesia, Fed. Sts.Middle East & North AfricaMiddle East & North Africa (excluding high income)Middle East & North Africa (IDA & IBRD countries)Middle incomeMoldovaMongoliaMontenegroMoroccoMozambiqueMyanmarNamibiaNepalNetherlandsNew CaledoniaNew ZealandNicaraguaNigerNigeriaNorth AmericaNorwayOECD membersOmanOther small statesPacific island small statesPakistanPalauPanamaPapua New GuineaParaguayPeruPhilippinesPolandPortugalPost-demographic dividendPre-demographic dividendQatarRomaniaRussian FederationRwandaSamoaSao Tome and PrincipeSaudi ArabiaSenegalSerbiaSeychellesSierra LeoneSingaporeSint Maarten (Dutch part)Slovak RepublicSloveniaSmall statesSolomon IslandsSouth AfricaSouth AsiaSouth Asia (IDA & IBRD)South SudanSpainSri LankaSt. Kitts and NevisSt. LuciaSt. Vincent and the GrenadinesSub-Saharan Africa Sub-Saharan Africa (excluding high income)Sub-Saharan Africa (IDA & IBRD countries)SudanSurinameSwazilandSwedenSwitzerlandSyrian Arab RepublicTajikistanTanzaniaThailandTimor-LesteTogoTongaTrinidad and TobagoTunisiaTurkeyTuvaluUgandaUkraineUnited KingdomUnited StatesUpper middle incomeUruguayVanuatuVenezuela, RBWest Bank and GazaWorldYemen, Rep.ZambiaZimbabwe Linha do tempo:
Nesta escala de tempo está apresentado um gráfico de 1978 ano até 2015 ano Sub-Saharan Africa (excluding high income). Dados de 1977 ano ausente. O número de observações reais por data: 38.
Fonte (nome):
Indicadores de desenvolvimento mundial
Fonte (organização):
International Monetary Fund, Balance of Payments Statistics Yearbook and data files.
Categorias:
Economy & Growth, Trade
Foi atualizado:
23 abr 2017 ano
Indicadores de alterações dos valores ao longo dos anos
Mínimo:
12.304
1 jan 1986 ano
Máximo:
24.078
1 jan 2004 ano
Na data de observação
Valor
Mudança absoluta
A alteração em relação ao valor anterior
1 jan 1978 ano
15.155
+15.155
0.0%
1 jan 1979 ano
14.543
-0.612
-4.04%
1 jan 1980 ano
14.123
-0.421
-2.89%
1 jan 1981 ano
17.008
+2.885
20.43%
1 jan 1982 ano
17.071
+0.063
0.37%
1 jan 1983 ano
17.626
+0.556
3.25%
1 jan 1984 ano
16.429
-1.197
-6.79%
1 jan 1985 ano
14.939
-1.49
-9.07%
1 jan 1986 ano
12.304
-2.636
-17.64%
1 jan 1987 ano
14.726
+2.422
19.69%
1 jan 1988 ano
17.181
+2.456
16.68%
1 jan 1989 ano
18.326
+1.145
6.66%
1 jan 1990 ano
19.099
+0.773
4.22%
1 jan 1991 ano
18.088
-1.011
-5.29%
1 jan 1992 ano
20.083
+1.995
11.03%
1 jan 1993 ano
18.872
-1.211
-6.03%
1 jan 1994 ano
19.757
+0.885
4.69%
1 jan 1995 ano
22.091
+2.335
11.82%
1 jan 1996 ano
20.278
-1.814
-8.21%
1 jan 1997 ano
20.717
+0.439
2.17%
1 jan 1998 ano
23.314
+2.597
12.54%
1 jan 1999 ano
22.863
-0.451
-1.93%
1 jan 2000 ano
20.641
-2.221
-9.72%
1 jan 2001 ano
21.815
+1.174
5.69%
1 jan 2002 ano
20.681
-1.134
-5.2%
1 jan 2003 ano
19.943
-0.738
-3.57%
1 jan 2004 ano
24.078
+4.135
20.73%
1 jan 2005 ano
20.386
-3.692
-15.33%
1 jan 2006 ano
17.342
-3.044
-14.93%
1 jan 2007 ano
20.178
+2.836
16.35%
1 jan 2008 ano
20.304
+0.126
0.63%
1 jan 2009 ano
21.352
+1.049
5.16%
1 jan 2010 ano
17.776
-3.576
-16.75%
1 jan 2011 ano
18.177
+0.401
2.26%
1 jan 2012 ano
16.79
-1.387
-7.63%
1 jan 2013 ano
15.104
-1.686
-10.04%
1 jan 2014 ano
14.791
-0.313
-2.07%
1 jan 2015 ano
13.931
-0.86
-5.81%
Classificação de países por estatísticas atuais por anos


Comentários: