29
/pt/
pt
AIzaSyAYiBZKx7MnpbEhh9jyipgxe19OcubqV5w
April 1, 2024
58847
Sub-Saharan Africa
SSF
false
2
1
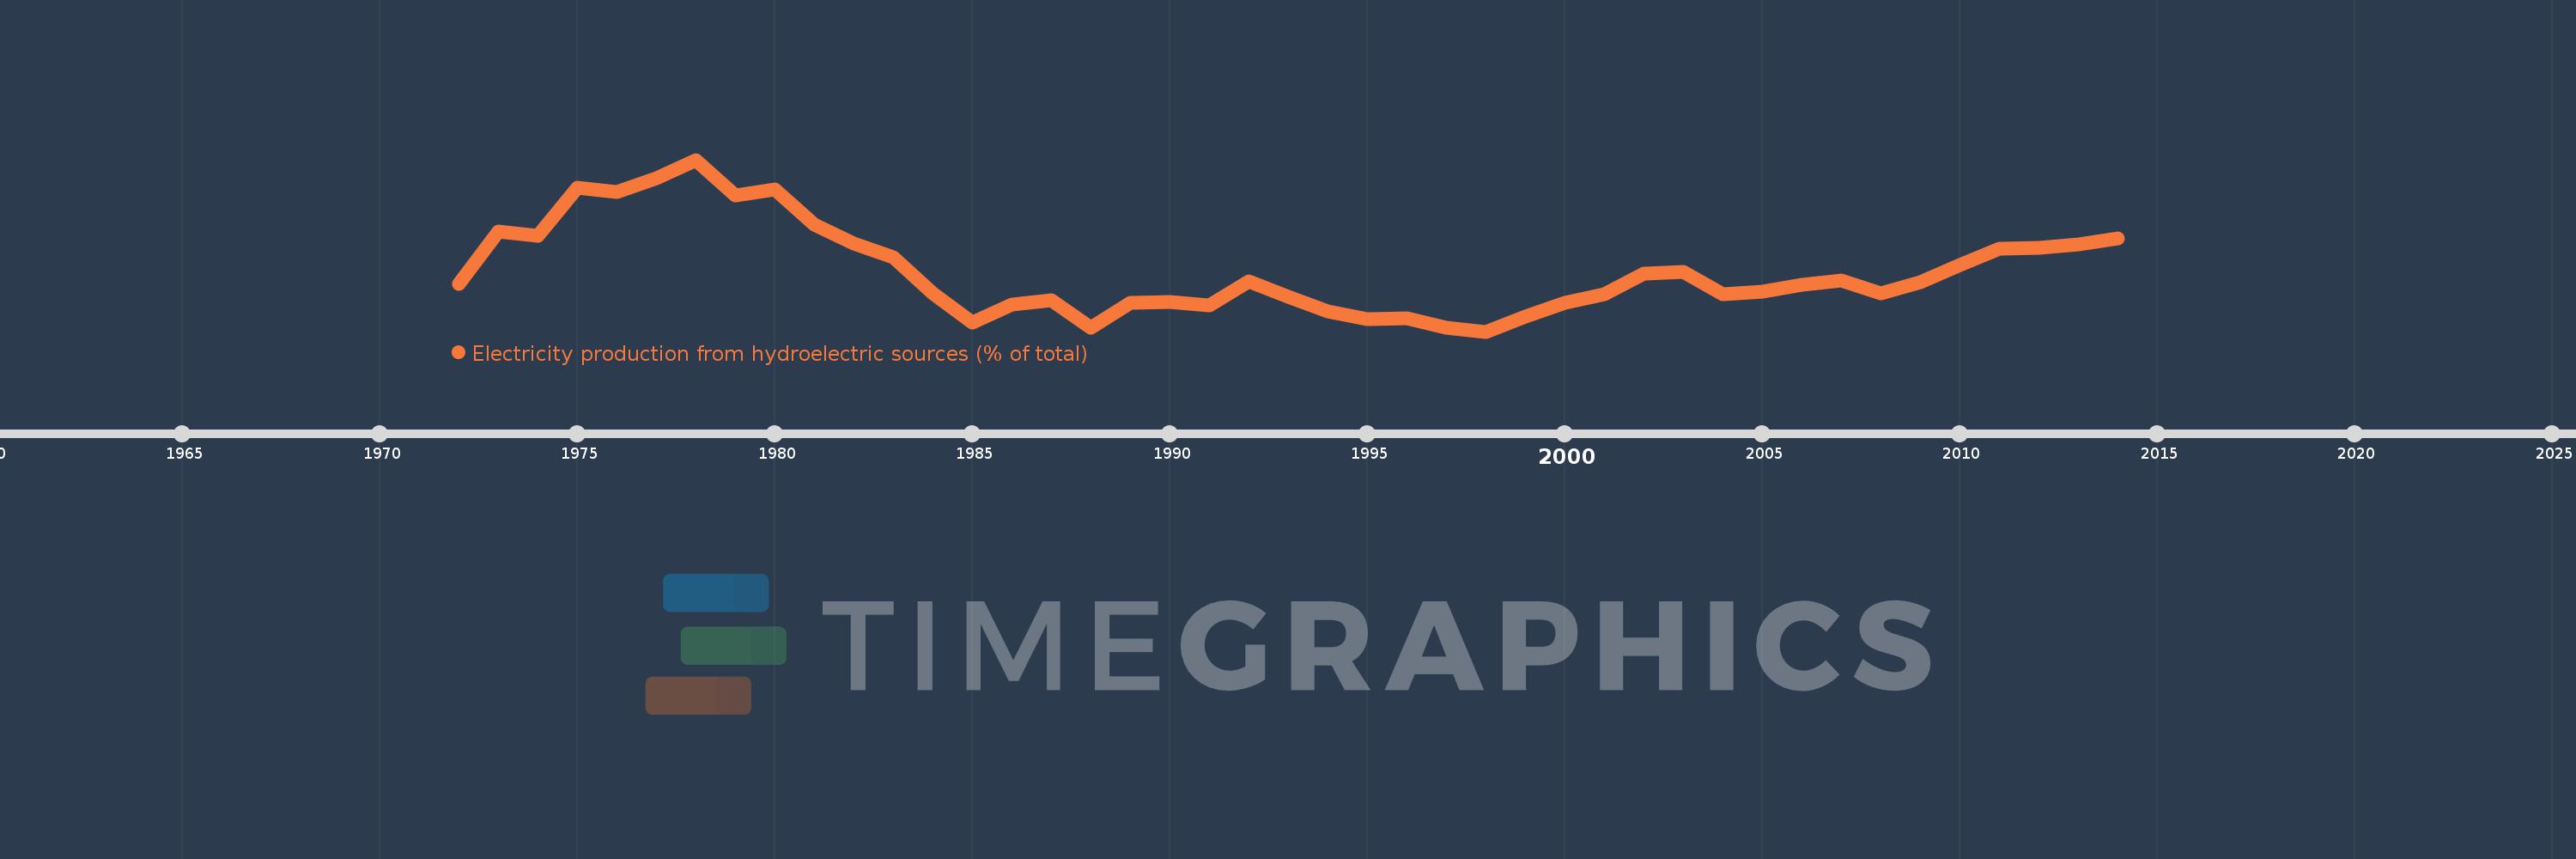
Electricity production from hydroelectric sources (% of total)
2014,2013,2012,2011,2010,2009,2008,2007,2006,2005,2004,2003,2002,2001,2000,1999,1998,1997,1996,1995,1994,1993,1992,1991,1990,1989,1988,1987,1986,1985,1984,1983,1982,1981,1980,1979,1978,1977,1976,1975,1974,1973,1972
Estas estatísticas em outros países:
AlbaniaAlgeriaAngolaArab WorldArgentinaArmeniaAustraliaAustriaAzerbaijanBahrainBangladeshBelarusBelgiumBeninBoliviaBosnia and HerzegovinaBotswanaBrazilBrunei DarussalamBulgariaCambodiaCameroonCanadaCentral Europe and the BalticsChileChinaColombiaCongo, Dem. Rep.Congo, Rep.Costa RicaCote d'IvoireCroatiaCubaCuracaoCyprusCzech RepublicDenmarkDominican RepublicEarly-demographic dividendEast Asia & PacificEast Asia & Pacific (excluding high income)East Asia & Pacific (IDA & IBRD countries)EcuadorEgypt, Arab Rep.El SalvadorEritreaEstoniaEthiopiaEuro areaEurope & Central AsiaEurope & Central Asia (excluding high income)Europe & Central Asia (IDA & IBRD countries)European UnionFinlandFragile and conflict affected situationsFranceGabonGeorgiaGermanyGhanaGibraltarGreeceGuatemalaHaitiHeavily indebted poor countries (HIPC)High incomeHondurasHong Kong SAR, ChinaHungaryIBRD onlyIcelandIDA & IBRD totalIDA blendIDA onlyIDA totalIndiaIndonesiaIran, Islamic Rep.IraqIrelandIsraelItalyJamaicaJapanJordanKazakhstanKenyaKorea, Dem. People’s Rep.Korea, Rep.KosovoKuwaitKyrgyz RepublicLate-demographic dividendLatin America & Caribbean Latin America & Caribbean (excluding high income)Latin America & the Caribbean (IDA & IBRD countries)LatviaLeast developed countries: UN classificationLebanonLibyaLithuaniaLow & middle incomeLower middle incomeLuxembourgMacedonia, FYRMalaysiaMaltaMauritiusMexicoMiddle East & North AfricaMiddle East & North Africa (excluding high income)Middle East & North Africa (IDA & IBRD countries)Middle incomeMoldovaMongoliaMontenegroMoroccoMozambiqueMyanmarNamibiaNepalNetherlandsNew ZealandNicaraguaNigerNigeriaNorth AmericaNorwayOECD membersOmanOther small statesPakistanPanamaParaguayPeruPhilippinesPolandPortugalPost-demographic dividendPre-demographic dividendQatarRomaniaRussian FederationSaudi ArabiaSenegalSerbiaSingaporeSlovak RepublicSloveniaSmall statesSouth AfricaSouth AsiaSouth Asia (IDA & IBRD)South SudanSpainSri LankaSub-Saharan Africa Sub-Saharan Africa (excluding high income)Sub-Saharan Africa (IDA & IBRD countries)SudanSwedenSwitzerlandSyrian Arab RepublicTajikistanTanzaniaThailandTogoTrinidad and TobagoTunisiaTurkeyTurkmenistanUkraineUnited Arab EmiratesUnited KingdomUnited StatesUpper middle incomeUruguayUzbekistanVenezuela, RBVietnamWorldYemen, Rep.ZambiaZimbabwe Linha do tempo:
Nesta escala de tempo está apresentado um gráfico de 1972 ano até 2014 ano Sub-Saharan Africa . Dados de 1971 ano ausente. O número de observações reais por data: 43.
Fonte (nome):
Indicadores de desenvolvimento mundial
Fonte (organização):
IEA Statistics © OECD/IEA 2014 (http://www.iea.org/stats/index.asp), subject to https://www.iea.org/t&c/termsandconditions/
Categorias:
Energy & Mining, Climate Change, Infrastructure
Foi atualizado:
23 abr 2017 ano
Indicadores de alterações dos valores ao longo dos anos
Mínimo:
14.891
1 jan 1998 ano
Máximo:
25.194
1 jan 1978 ano
Na data de observação
Valor
Mudança absoluta
A alteração em relação ao valor anterior
1 jan 1972 ano
17.742
+17.742
0.0%
1 jan 1973 ano
20.905
+3.163
17.83%
1 jan 1974 ano
20.61
-0.294
-1.41%
1 jan 1975 ano
23.535
+2.925
14.19%
1 jan 1976 ano
23.27
-0.265
-1.13%
1 jan 1977 ano
24.063
+0.793
3.41%
1 jan 1978 ano
25.194
+1.131
4.7%
1 jan 1979 ano
23.064
-2.129
-8.45%
1 jan 1980 ano
23.401
+0.337
1.46%
1 jan 1981 ano
21.289
-2.112
-9.03%
1 jan 1982 ano
20.194
-1.095
-5.14%
1 jan 1983 ano
19.333
-0.861
-4.27%
1 jan 1984 ano
17.194
-2.139
-11.07%
1 jan 1985 ano
15.453
-1.741
-10.12%
1 jan 1986 ano
16.52
+1.067
6.9%
1 jan 1987 ano
16.797
+0.277
1.68%
1 jan 1988 ano
15.127
-1.67
-9.94%
1 jan 1989 ano
16.619
+1.491
9.86%
1 jan 1990 ano
16.686
+0.068
0.41%
1 jan 1991 ano
16.45
-0.236
-1.42%
1 jan 1992 ano
17.924
+1.473
8.96%
1 jan 1993 ano
16.996
-0.927
-5.17%
1 jan 1994 ano
16.097
-0.899
-5.29%
1 jan 1995 ano
15.622
-0.475
-2.95%
1 jan 1996 ano
15.709
+0.088
0.56%
1 jan 1997 ano
15.145
-0.564
-3.59%
1 jan 1998 ano
14.891
-0.254
-1.68%
1 jan 1999 ano
15.767
+0.877
5.89%
1 jan 2000 ano
16.593
+0.825
5.23%
1 jan 2001 ano
17.157
+0.564
3.4%
1 jan 2002 ano
18.361
+1.204
7.02%
1 jan 2003 ano
18.489
+0.128
0.7%
1 jan 2004 ano
17.122
-1.367
-7.39%
1 jan 2005 ano
17.283
+0.16
0.94%
1 jan 2006 ano
17.692
+0.41
2.37%
1 jan 2007 ano
17.962
+0.269
1.52%
1 jan 2008 ano
17.208
-0.754
-4.2%
1 jan 2009 ano
17.839
+0.632
3.67%
1 jan 2010 ano
18.879
+1.04
5.83%
1 jan 2011 ano
19.868
+0.989
5.24%
1 jan 2012 ano
19.931
+0.064
0.32%
1 jan 2013 ano
20.142
+0.211
1.06%
1 jan 2014 ano
20.459
+0.316
1.57%
Classificação de países por estatísticas atuais por anos


Comentários: