29
/pt/
pt
AIzaSyAYiBZKx7MnpbEhh9jyipgxe19OcubqV5w
April 1, 2024
157166
Iran, Islamic Rep.
IRN
true
2
1
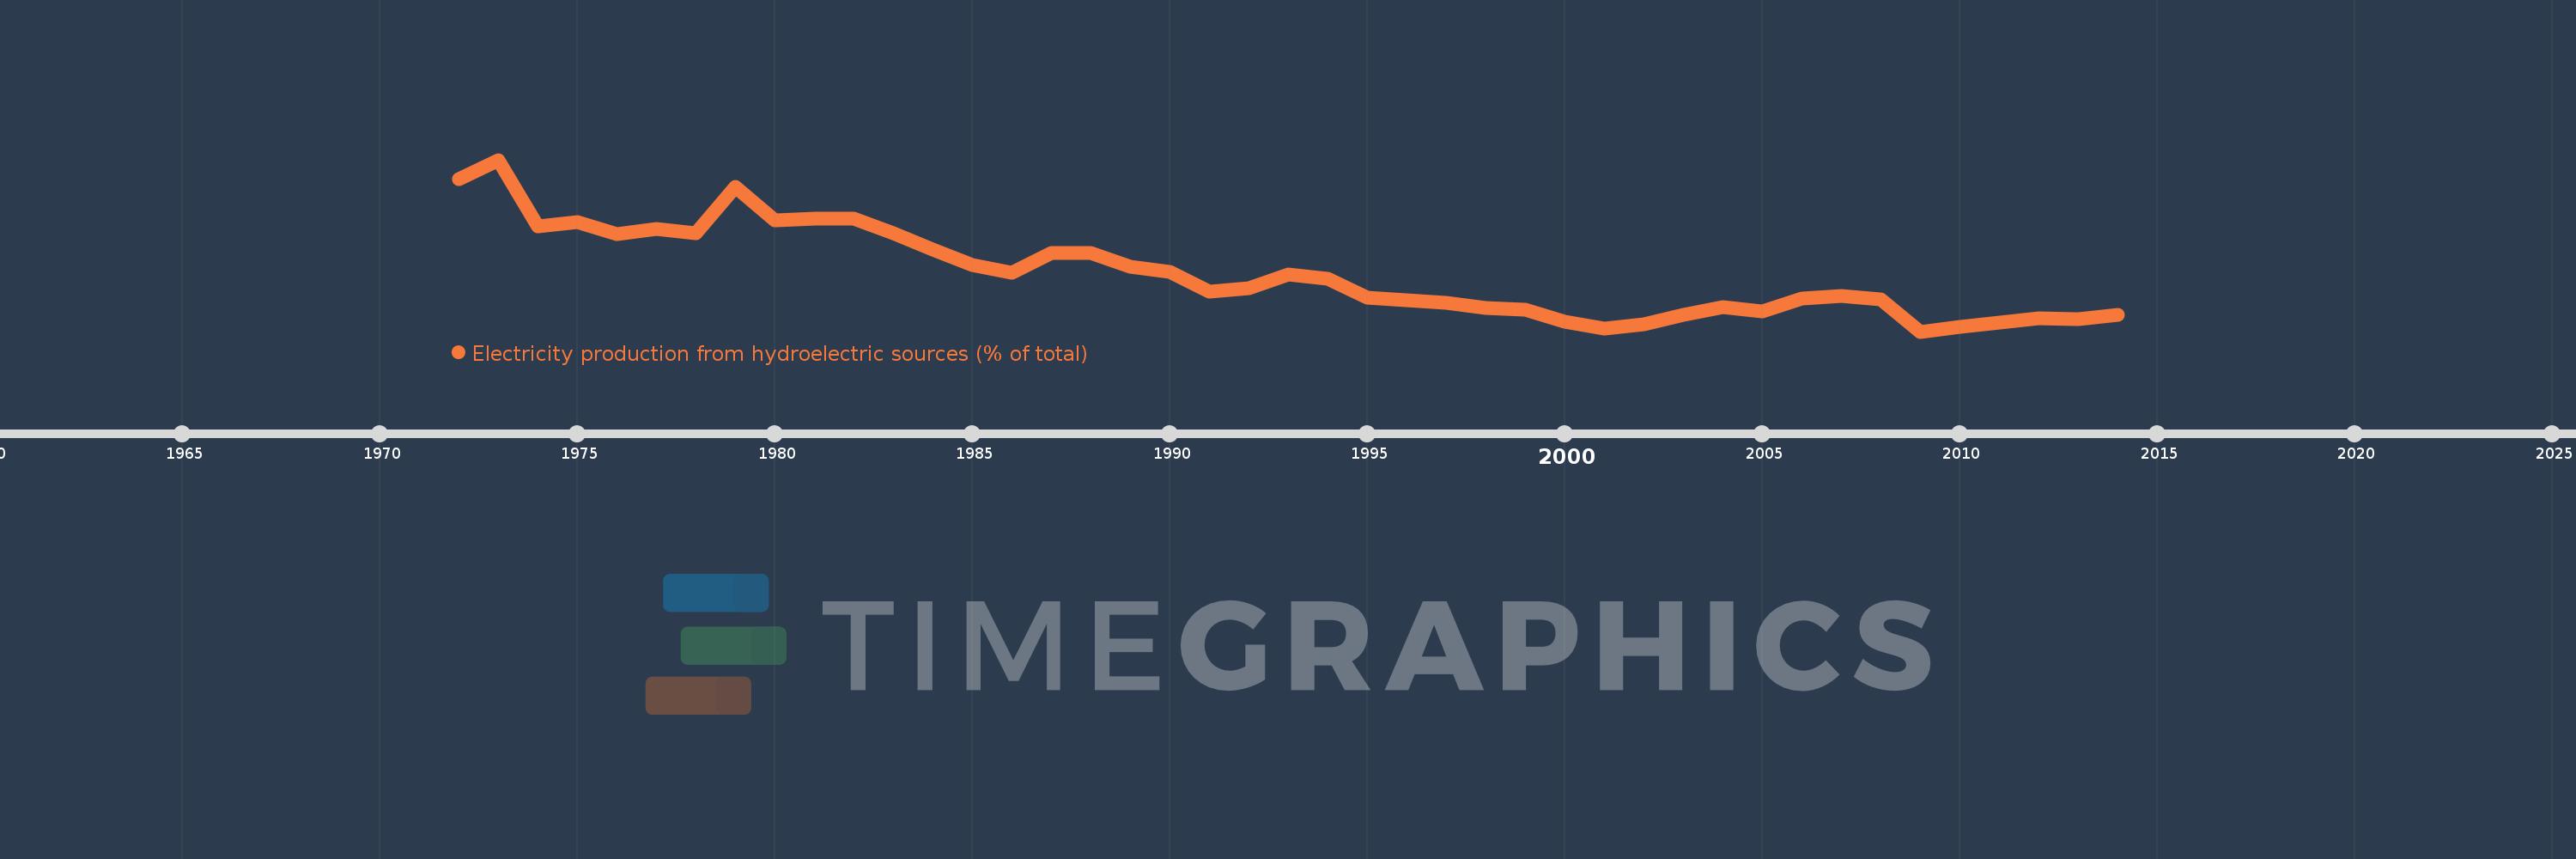
Electricity production from hydroelectric sources (% of total)
2014,2013,2012,2011,2010,2009,2008,2007,2006,2005,2004,2003,2002,2001,2000,1999,1998,1997,1996,1995,1994,1993,1992,1991,1990,1989,1988,1987,1986,1985,1984,1983,1982,1981,1980,1979,1978,1977,1976,1975,1974,1973,1972
Estas estatísticas em outros países:
AlbaniaAlgeriaAngolaArab WorldArgentinaArmeniaAustraliaAustriaAzerbaijanBahrainBangladeshBelarusBelgiumBeninBoliviaBosnia and HerzegovinaBotswanaBrazilBrunei DarussalamBulgariaCambodiaCameroonCanadaCentral Europe and the BalticsChileChinaColombiaCongo, Dem. Rep.Congo, Rep.Costa RicaCote d'IvoireCroatiaCubaCuracaoCyprusCzech RepublicDenmarkDominican RepublicEarly-demographic dividendEast Asia & PacificEast Asia & Pacific (excluding high income)East Asia & Pacific (IDA & IBRD countries)EcuadorEgypt, Arab Rep.El SalvadorEritreaEstoniaEthiopiaEuro areaEurope & Central AsiaEurope & Central Asia (excluding high income)Europe & Central Asia (IDA & IBRD countries)European UnionFinlandFragile and conflict affected situationsFranceGabonGeorgiaGermanyGhanaGibraltarGreeceGuatemalaHaitiHeavily indebted poor countries (HIPC)High incomeHondurasHong Kong SAR, ChinaHungaryIBRD onlyIcelandIDA & IBRD totalIDA blendIDA onlyIDA totalIndiaIndonesiaIran, Islamic Rep.IraqIrelandIsraelItalyJamaicaJapanJordanKazakhstanKenyaKorea, Dem. People’s Rep.Korea, Rep.KosovoKuwaitKyrgyz RepublicLate-demographic dividendLatin America & Caribbean Latin America & Caribbean (excluding high income)Latin America & the Caribbean (IDA & IBRD countries)LatviaLeast developed countries: UN classificationLebanonLibyaLithuaniaLow & middle incomeLower middle incomeLuxembourgMacedonia, FYRMalaysiaMaltaMauritiusMexicoMiddle East & North AfricaMiddle East & North Africa (excluding high income)Middle East & North Africa (IDA & IBRD countries)Middle incomeMoldovaMongoliaMontenegroMoroccoMozambiqueMyanmarNamibiaNepalNetherlandsNew ZealandNicaraguaNigerNigeriaNorth AmericaNorwayOECD membersOmanOther small statesPakistanPanamaParaguayPeruPhilippinesPolandPortugalPost-demographic dividendPre-demographic dividendQatarRomaniaRussian FederationSaudi ArabiaSenegalSerbiaSingaporeSlovak RepublicSloveniaSmall statesSouth AfricaSouth AsiaSouth Asia (IDA & IBRD)South SudanSpainSri LankaSub-Saharan Africa Sub-Saharan Africa (excluding high income)Sub-Saharan Africa (IDA & IBRD countries)SudanSwedenSwitzerlandSyrian Arab RepublicTajikistanTanzaniaThailandTogoTrinidad and TobagoTunisiaTurkeyTurkmenistanUkraineUnited Arab EmiratesUnited KingdomUnited StatesUpper middle incomeUruguayUzbekistanVenezuela, RBVietnamWorldYemen, Rep.ZambiaZimbabwe Linha do tempo:
Nesta escala de tempo está apresentado um gráfico de 1972 ano até 2014 ano Iran, Islamic Rep.. Dados de 1971 ano ausente. O número de observações reais por data: 43.
Fonte (nome):
Indicadores de desenvolvimento mundial
Fonte (organização):
IEA Statistics © OECD/IEA 2014 (http://www.iea.org/stats/index.asp), subject to https://www.iea.org/t&c/termsandconditions/
Categorias:
Energy & Mining, Climate Change, Infrastructure
Foi atualizado:
23 abr 2017 ano
Indicadores de alterações dos valores ao longo dos anos
Mínimo:
2.332
1 jan 2009 ano
Máximo:
36.931
1 jan 1973 ano
Na data de observação
Valor
Mudança absoluta
A alteração em relação ao valor anterior
1 jan 1972 ano
33.054
+33.054
0.0%
1 jan 1973 ano
36.931
+3.877
11.73%
1 jan 1974 ano
23.501
-13.43
-36.36%
1 jan 1975 ano
24.427
+0.926
3.94%
1 jan 1976 ano
21.943
-2.484
-10.17%
1 jan 1977 ano
22.962
+1.02
4.65%
1 jan 1978 ano
22.192
-0.77
-3.35%
1 jan 1979 ano
31.486
+9.293
41.88%
1 jan 1980 ano
24.734
-6.752
-21.44%
1 jan 1981 ano
25.112
+0.378
1.53%
1 jan 1982 ano
25.01
-0.102
-0.4%
1 jan 1983 ano
22.173
-2.837
-11.34%
1 jan 1984 ano
18.792
-3.381
-15.25%
1 jan 1985 ano
15.713
-3.079
-16.38%
1 jan 1986 ano
14.151
-1.562
-9.94%
1 jan 1987 ano
18.082
+3.931
27.78%
1 jan 1988 ano
18.161
+0.079
0.44%
1 jan 1989 ano
15.359
-2.802
-15.43%
1 jan 1990 ano
14.27
-1.089
-7.09%
1 jan 1991 ano
10.292
-3.978
-27.87%
1 jan 1992 ano
11.003
+0.711
6.91%
1 jan 1993 ano
13.877
+2.873
26.11%
1 jan 1994 ano
12.89
-0.986
-7.11%
1 jan 1995 ano
9.093
-3.798
-29.46%
1 jan 1996 ano
8.576
-0.517
-5.68%
1 jan 1997 ano
8.135
-0.441
-5.14%
1 jan 1998 ano
7.087
-1.048
-12.88%
1 jan 1999 ano
6.804
-0.283
-3.99%
1 jan 2000 ano
4.389
-2.416
-35.5%
1 jan 2001 ano
3.007
-1.381
-31.47%
1 jan 2002 ano
3.885
+0.877
29.17%
1 jan 2003 ano
5.707
+1.823
46.92%
1 jan 2004 ano
7.212
+1.505
26.37%
1 jan 2005 ano
6.367
-0.846
-11.72%
1 jan 2006 ano
9.04
+2.674
42.0%
1 jan 2007 ano
9.48
+0.439
4.86%
1 jan 2008 ano
8.818
-0.662
-6.98%
1 jan 2009 ano
2.332
-6.486
-73.55%
1 jan 2010 ano
3.267
+0.935
40.11%
1 jan 2011 ano
4.089
+0.822
25.15%
1 jan 2012 ano
5.023
+0.934
22.84%
1 jan 2013 ano
4.895
-0.128
-2.55%
1 jan 2014 ano
5.638
+0.743
15.18%
Classificação de países por estatísticas atuais por anos


Comentários: