29
/pt/
pt
AIzaSyAYiBZKx7MnpbEhh9jyipgxe19OcubqV5w
April 1, 2024
57665
South Asia
SAS
false
2
1
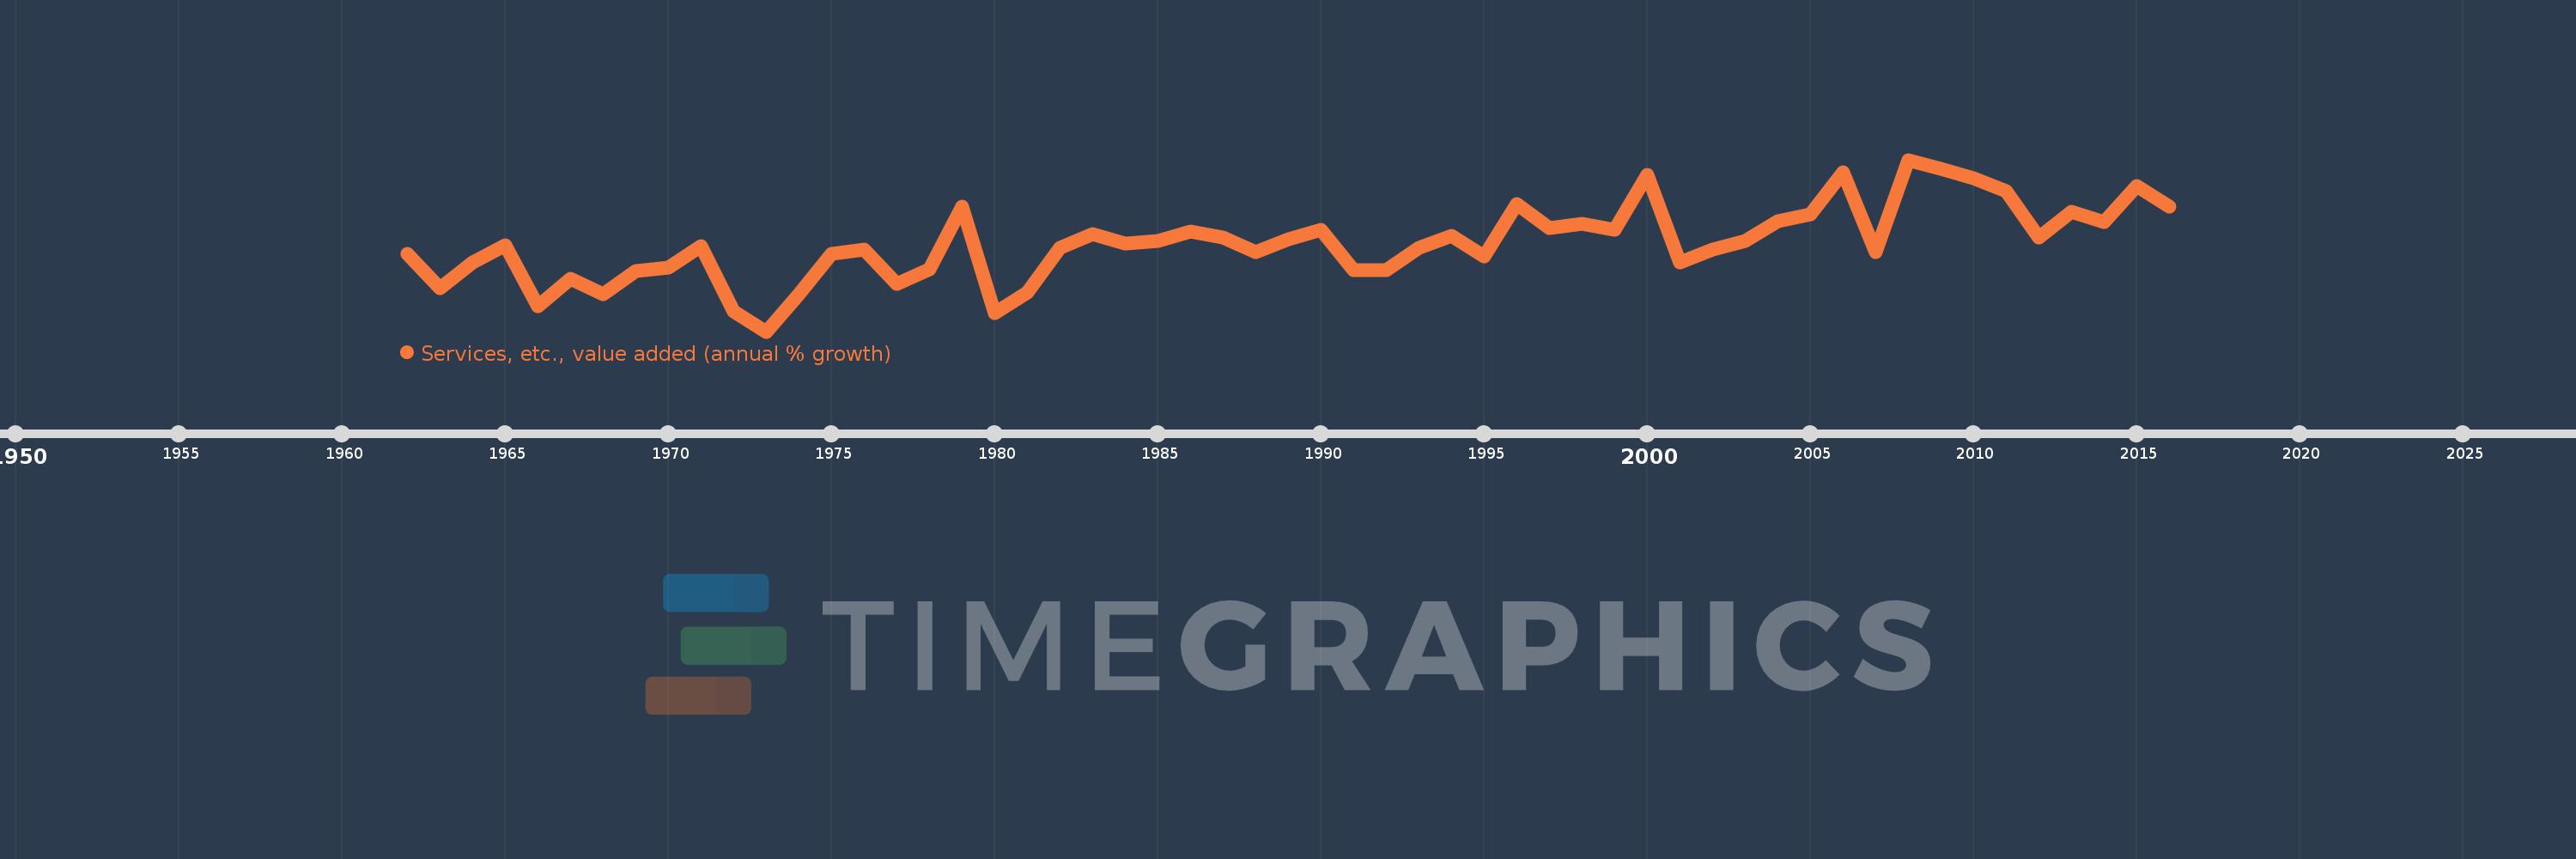
Services, etc., value added (annual % growth)
2016,2015,2014,2013,2012,2011,2010,2009,2008,2007,2006,2005,2004,2003,2002,2001,2000,1999,1998,1997,1996,1995,1994,1993,1992,1991,1990,1989,1988,1987,1986,1985,1984,1983,1982,1981,1980,1979,1978,1977,1976,1975,1974,1973,1972,1971,1970,1969,1968,1967,1966,1965,1964,1963,1962
Estas estatísticas em outros países:
AfghanistanAlbaniaAlgeriaAntigua and BarbudaArab WorldArgentinaArmeniaAustraliaAustriaAzerbaijanBahamas, TheBahrainBangladeshBelarusBelgiumBelizeBeninBermudaBhutanBoliviaBosnia and HerzegovinaBotswanaBrazilBrunei DarussalamBulgariaBurkina FasoBurundiCabo VerdeCambodiaCameroonCanadaCaribbean small statesCentral African RepublicCentral Europe and the BalticsChadChileChinaColombiaComorosCongo, Dem. Rep.Congo, Rep.Costa RicaCote d'IvoireCroatiaCubaCyprusCzech RepublicDenmarkDjiboutiDominicaDominican RepublicEarly-demographic dividendEast Asia & PacificEast Asia & Pacific (excluding high income)East Asia & Pacific (IDA & IBRD countries)EcuadorEgypt, Arab Rep.El SalvadorEquatorial GuineaEritreaEstoniaEthiopiaEuro areaEurope & Central AsiaEurope & Central Asia (excluding high income)Europe & Central Asia (IDA & IBRD countries)European UnionFijiFinlandFragile and conflict affected situationsFranceGabonGambia, TheGeorgiaGermanyGhanaGreeceGrenadaGuatemalaGuineaGuinea-BissauGuyanaHaitiHeavily indebted poor countries (HIPC)High incomeHondurasHong Kong SAR, ChinaHungaryIBRD onlyIcelandIDA & IBRD totalIDA blendIDA onlyIDA totalIndiaIndonesiaIran, Islamic Rep.IraqIrelandItalyJamaicaJapanJordanKazakhstanKenyaKiribatiKorea, Rep.KosovoKuwaitKyrgyz RepublicLao PDRLate-demographic dividendLatin America & Caribbean Latin America & Caribbean (excluding high income)Latin America & the Caribbean (IDA & IBRD countries)LatviaLeast developed countries: UN classificationLebanonLesothoLiberiaLithuaniaLow & middle incomeLow incomeLower middle incomeLuxembourgMacedonia, FYRMadagascarMalawiMalaysiaMaldivesMaliMarshall IslandsMauritaniaMauritiusMexicoMicronesia, Fed. Sts.Middle East & North AfricaMiddle East & North Africa (excluding high income)Middle East & North Africa (IDA & IBRD countries)Middle incomeMoldovaMongoliaMontenegroMoroccoMozambiqueMyanmarNamibiaNepalNetherlandsNew ZealandNicaraguaNigerNigeriaNorth AmericaNorwayOECD membersOmanOther small statesPacific island small statesPakistanPalauPanamaPapua New GuineaParaguayPeruPhilippinesPolandPortugalPost-demographic dividendPre-demographic dividendPuerto RicoQatarRomaniaRussian FederationRwandaSamoaSao Tome and PrincipeSaudi ArabiaSenegalSerbiaSeychellesSierra LeoneSingaporeSlovak RepublicSloveniaSmall statesSolomon IslandsSomaliaSouth AfricaSouth AsiaSouth Asia (IDA & IBRD)SpainSri LankaSt. Kitts and NevisSt. LuciaSt. Vincent and the GrenadinesSub-Saharan Africa Sub-Saharan Africa (excluding high income)Sub-Saharan Africa (IDA & IBRD countries)SudanSurinameSwazilandSwedenSwitzerlandSyrian Arab RepublicTajikistanTanzaniaThailandTimor-LesteTogoTongaTrinidad and TobagoTunisiaTurkeyTurkmenistanTuvaluUgandaUkraineUnited Arab EmiratesUnited KingdomUnited StatesUpper middle incomeUruguayUzbekistanVanuatuVenezuela, RBVietnamWest Bank and GazaWorldZambiaZimbabwe Linha do tempo:
Nesta escala de tempo está apresentado um gráfico de 1962 ano até 2016 ano South Asia. Dados de 1961 ano ausente. O número de observações reais por data: 55.
Fonte (nome):
Indicadores de desenvolvimento mundial
Fonte (organização):
World Bank national accounts data, and OECD National Accounts data files.
Categorias:
Economy & Growth
Foi atualizado:
23 abr 2017 ano
Indicadores de alterações dos valores ao longo dos anos
Mínimo:
1.246
1 jan 1973 ano
Máximo:
10.647
1 jan 2008 ano
Na data de observação
Valor
Mudança absoluta
A alteração em relação ao valor anterior
1 jan 1962 ano
5.494
+5.494
0.0%
1 jan 1963 ano
3.635
-1.859
-33.84%
1 jan 1964 ano
5.011
+1.376
37.86%
1 jan 1965 ano
5.97
+0.958
19.12%
1 jan 1966 ano
2.613
-3.357
-56.23%
1 jan 1967 ano
4.115
+1.502
57.48%
1 jan 1968 ano
3.283
-0.832
-20.22%
1 jan 1969 ano
4.555
+1.273
38.77%
1 jan 1970 ano
4.731
+0.175
3.85%
1 jan 1971 ano
5.917
+1.186
25.08%
1 jan 1972 ano
2.329
-3.588
-60.65%
1 jan 1973 ano
1.246
-1.083
-46.5%
1 jan 1974 ano
3.27
+2.025
162.52%
1 jan 1975 ano
5.492
+2.221
67.92%
1 jan 1976 ano
5.728
+0.237
4.31%
1 jan 1977 ano
3.848
-1.88
-32.82%
1 jan 1978 ano
4.65
+0.802
20.85%
1 jan 1979 ano
8.093
+3.442
74.03%
1 jan 1980 ano
2.259
-5.834
-72.08%
1 jan 1981 ano
3.38
+1.121
49.64%
1 jan 1982 ano
5.826
+2.445
72.34%
1 jan 1983 ano
6.574
+0.748
12.84%
1 jan 1984 ano
6.082
-0.492
-7.48%
1 jan 1985 ano
6.185
+0.103
1.69%
1 jan 1986 ano
6.701
+0.517
8.35%
1 jan 1987 ano
6.402
-0.299
-4.46%
1 jan 1988 ano
5.582
-0.82
-12.81%
1 jan 1989 ano
6.313
+0.731
13.1%
1 jan 1990 ano
6.802
+0.489
7.74%
1 jan 1991 ano
4.627
-2.175
-31.97%
1 jan 1992 ano
4.604
-0.024
-0.51%
1 jan 1993 ano
5.844
+1.24
26.94%
1 jan 1994 ano
6.479
+0.635
10.87%
1 jan 1995 ano
5.363
-1.116
-17.22%
1 jan 1996 ano
8.226
+2.863
53.38%
1 jan 1997 ano
6.913
-1.313
-15.96%
1 jan 1998 ano
7.156
+0.243
3.52%
1 jan 1999 ano
6.838
-0.319
-4.45%
1 jan 2000 ano
9.82
+2.982
43.61%
1 jan 2001 ano
5.039
-4.78
-48.68%
1 jan 2002 ano
5.724
+0.685
13.59%
1 jan 2003 ano
6.195
+0.471
8.22%
1 jan 2004 ano
7.276
+1.082
17.46%
1 jan 2005 ano
7.642
+0.366
5.02%
1 jan 2006 ano
9.972
+2.33
30.49%
1 jan 2007 ano
5.584
-4.387
-44.0%
1 jan 2008 ano
10.647
+5.062
90.65%
1 jan 2009 ano
10.138
-0.509
-4.78%
1 jan 2010 ano
9.646
-0.492
-4.85%
1 jan 2011 ano
8.919
-0.727
-7.54%
1 jan 2012 ano
6.39
-2.529
-28.35%
1 jan 2013 ano
7.814
+1.423
22.27%
1 jan 2014 ano
7.234
-0.579
-7.41%
1 jan 2015 ano
9.221
+1.987
27.46%
1 jan 2016 ano
8.102
-1.118
-12.13%
Classificação de países por estatísticas atuais por anos


Comentários: