29
/pt/
pt
AIzaSyAYiBZKx7MnpbEhh9jyipgxe19OcubqV5w
April 1, 2024
193679
Mauritania
MRT
true
2
1
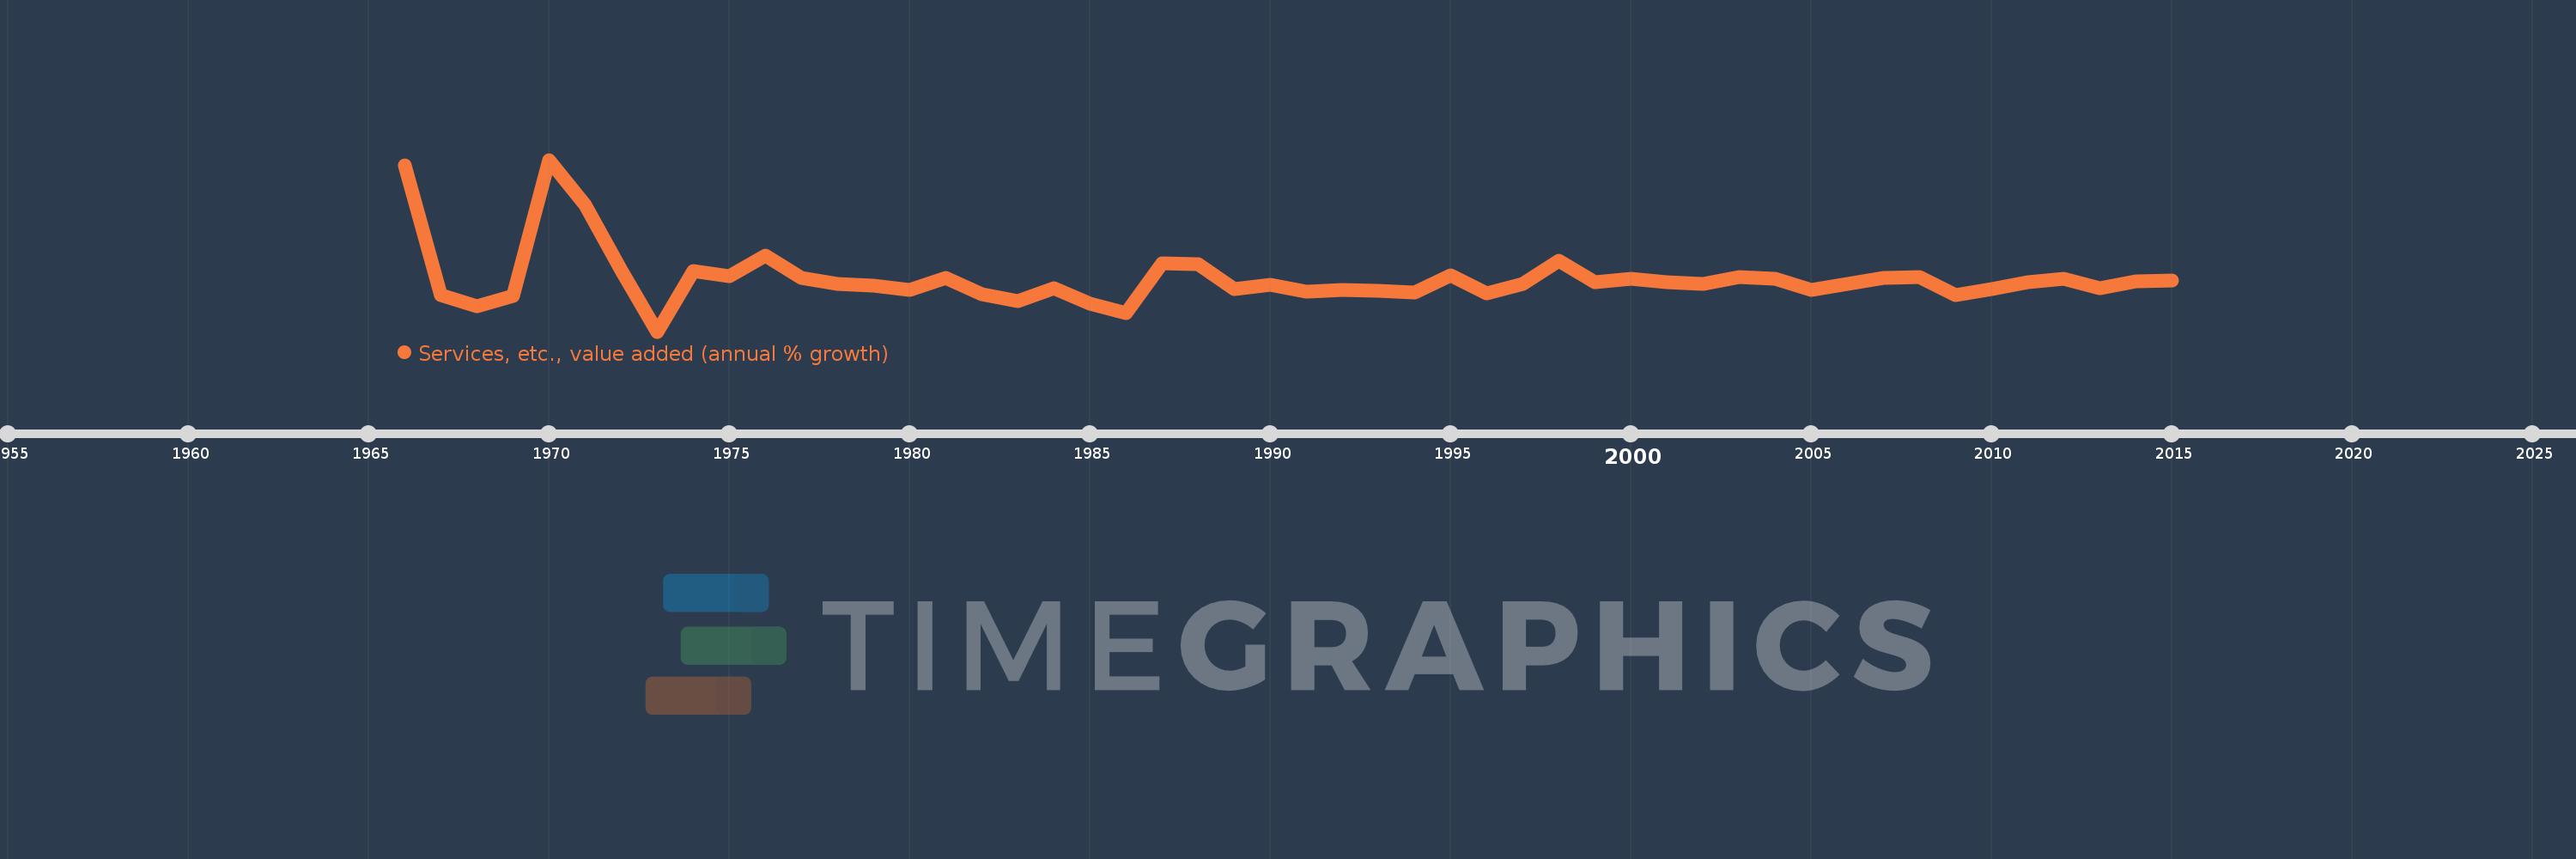
Services, etc., value added (annual % growth)
2015,2014,2013,2012,2011,2010,2009,2008,2007,2006,2005,2004,2003,2002,2001,2000,1999,1998,1997,1996,1995,1994,1993,1992,1991,1990,1989,1988,1987,1986,1985,1984,1983,1982,1981,1980,1979,1978,1977,1976,1975,1974,1973,1972,1971,1970,1969,1968,1967,1966
Estas estatísticas em outros países:
AfghanistanAlbaniaAlgeriaAntigua and BarbudaArab WorldArgentinaArmeniaAustraliaAustriaAzerbaijanBahamas, TheBahrainBangladeshBelarusBelgiumBelizeBeninBermudaBhutanBoliviaBosnia and HerzegovinaBotswanaBrazilBrunei DarussalamBulgariaBurkina FasoBurundiCabo VerdeCambodiaCameroonCanadaCaribbean small statesCentral African RepublicCentral Europe and the BalticsChadChileChinaColombiaComorosCongo, Dem. Rep.Congo, Rep.Costa RicaCote d'IvoireCroatiaCubaCyprusCzech RepublicDenmarkDjiboutiDominicaDominican RepublicEarly-demographic dividendEast Asia & PacificEast Asia & Pacific (excluding high income)East Asia & Pacific (IDA & IBRD countries)EcuadorEgypt, Arab Rep.El SalvadorEquatorial GuineaEritreaEstoniaEthiopiaEuro areaEurope & Central AsiaEurope & Central Asia (excluding high income)Europe & Central Asia (IDA & IBRD countries)European UnionFijiFinlandFragile and conflict affected situationsFranceGabonGambia, TheGeorgiaGermanyGhanaGreeceGrenadaGuatemalaGuineaGuinea-BissauGuyanaHaitiHeavily indebted poor countries (HIPC)High incomeHondurasHong Kong SAR, ChinaHungaryIBRD onlyIcelandIDA & IBRD totalIDA blendIDA onlyIDA totalIndiaIndonesiaIran, Islamic Rep.IraqIrelandItalyJamaicaJapanJordanKazakhstanKenyaKiribatiKorea, Rep.KosovoKuwaitKyrgyz RepublicLao PDRLate-demographic dividendLatin America & Caribbean Latin America & Caribbean (excluding high income)Latin America & the Caribbean (IDA & IBRD countries)LatviaLeast developed countries: UN classificationLebanonLesothoLiberiaLithuaniaLow & middle incomeLow incomeLower middle incomeLuxembourgMacedonia, FYRMadagascarMalawiMalaysiaMaldivesMaliMarshall IslandsMauritaniaMauritiusMexicoMicronesia, Fed. Sts.Middle East & North AfricaMiddle East & North Africa (excluding high income)Middle East & North Africa (IDA & IBRD countries)Middle incomeMoldovaMongoliaMontenegroMoroccoMozambiqueMyanmarNamibiaNepalNetherlandsNew ZealandNicaraguaNigerNigeriaNorth AmericaNorwayOECD membersOmanOther small statesPacific island small statesPakistanPalauPanamaPapua New GuineaParaguayPeruPhilippinesPolandPortugalPost-demographic dividendPre-demographic dividendPuerto RicoQatarRomaniaRussian FederationRwandaSamoaSao Tome and PrincipeSaudi ArabiaSenegalSerbiaSeychellesSierra LeoneSingaporeSlovak RepublicSloveniaSmall statesSolomon IslandsSomaliaSouth AfricaSouth AsiaSouth Asia (IDA & IBRD)SpainSri LankaSt. Kitts and NevisSt. LuciaSt. Vincent and the GrenadinesSub-Saharan Africa Sub-Saharan Africa (excluding high income)Sub-Saharan Africa (IDA & IBRD countries)SudanSurinameSwazilandSwedenSwitzerlandSyrian Arab RepublicTajikistanTanzaniaThailandTimor-LesteTogoTongaTrinidad and TobagoTunisiaTurkeyTurkmenistanTuvaluUgandaUkraineUnited Arab EmiratesUnited KingdomUnited StatesUpper middle incomeUruguayUzbekistanVanuatuVenezuela, RBVietnamWest Bank and GazaWorldZambiaZimbabwe Linha do tempo:
Nesta escala de tempo está apresentado um gráfico de 1966 ano até 2015 ano Mauritania. Dados de 1965 ano ausente. O número de observações reais por data: 50.
Fonte (nome):
Indicadores de desenvolvimento mundial
Fonte (organização):
World Bank national accounts data, and OECD National Accounts data files.
Categorias:
Economy & Growth
Foi atualizado:
23 abr 2017 ano
Indicadores de alterações dos valores ao longo dos anos
Mínimo:
-37.939
1 jan 1973 ano
Máximo:
116.477
1 jan 1970 ano
Na data de observação
Valor
Mudança absoluta
A alteração em relação ao valor anterior
1 jan 1966 ano
111.346
+111.346
0.0%
1 jan 1967 ano
-4.74
-116.087
-104.26%
1 jan 1968 ano
-15.134
-10.394
219.26%
1 jan 1969 ano
-6.082
+9.052
-59.81%
1 jan 1970 ano
116.477
+122.56
-2.01 mil%
1 jan 1971 ano
76.201
-40.276
-34.58%
1 jan 1972 ano
17.471
-58.73
-77.07%
1 jan 1973 ano
-37.939
-55.41
-317.16%
1 jan 1974 ano
16.489
+54.428
-143.46%
1 jan 1975 ano
11.995
-4.494
-27.26%
1 jan 1976 ano
30.283
+18.288
152.47%
1 jan 1977 ano
10.422
-19.861
-65.59%
1 jan 1978 ano
4.681
-5.741
-55.08%
1 jan 1979 ano
3.264
-1.417
-30.28%
1 jan 1980 ano
-0.127
-3.39
-103.88%
1 jan 1981 ano
10.65
+10.777
-8.5 mil%
1 jan 1982 ano
-4.001
-14.651
-137.57%
1 jan 1983 ano
-10.248
-6.247
156.11%
1 jan 1984 ano
1.164
+11.412
-111.36%
1 jan 1985 ano
-12.537
-13.7
-1.18 mil%
1 jan 1986 ano
-21.27
-8.733
69.66%
1 jan 1987 ano
23.437
+44.707
-210.19%
1 jan 1988 ano
22.875
-0.562
-2.4%
1 jan 1989 ano
-0.037
-22.912
-100.16%
1 jan 1990 ano
3.943
+3.98
-10.82 mil%
1 jan 1991 ano
-1.793
-5.736
-145.46%
1 jan 1992 ano
-0.765
+1.028
-57.33%
1 jan 1993 ano
-1.328
-0.563
73.65%
1 jan 1994 ano
-2.608
-1.28
96.36%
1 jan 1995 ano
12.722
+15.33
-587.73%
1 jan 1996 ano
-3.285
-16.007
-125.82%
1 jan 1997 ano
5.042
+8.327
-253.5%
1 jan 1998 ano
25.55
+20.508
406.71%
1 jan 1999 ano
6.36
-19.19
-75.11%
1 jan 2000 ano
9.67
+3.31
52.05%
1 jan 2001 ano
6.566
-3.104
-32.1%
1 jan 2002 ano
5.2
-1.366
-20.8%
1 jan 2003 ano
10.807
+5.607
107.82%
1 jan 2004 ano
9.739
-1.068
-9.88%
1 jan 2005 ano
-0.575
-10.315
-105.91%
1 jan 2006 ano
4.86
+5.436
-944.91%
1 jan 2007 ano
10.158
+5.297
108.99%
1 jan 2008 ano
10.711
+0.553
5.45%
1 jan 2009 ano
-5.138
-15.849
-147.97%
1 jan 2010 ano
0.558
+5.696
-110.87%
1 jan 2011 ano
6.213
+5.655
1.01 mil%
1 jan 2012 ano
9.322
+3.108
50.03%
1 jan 2013 ano
1.088
-8.233
-88.32%
1 jan 2014 ano
7.006
+5.917
543.66%
1 jan 2015 ano
8.076
+1.07
15.27%
Classificação de países por estatísticas atuais por anos


Comentários: