29
/pt/
pt
AIzaSyAYiBZKx7MnpbEhh9jyipgxe19OcubqV5w
April 1, 2024
53572
Other small states
OSS
false
2
1
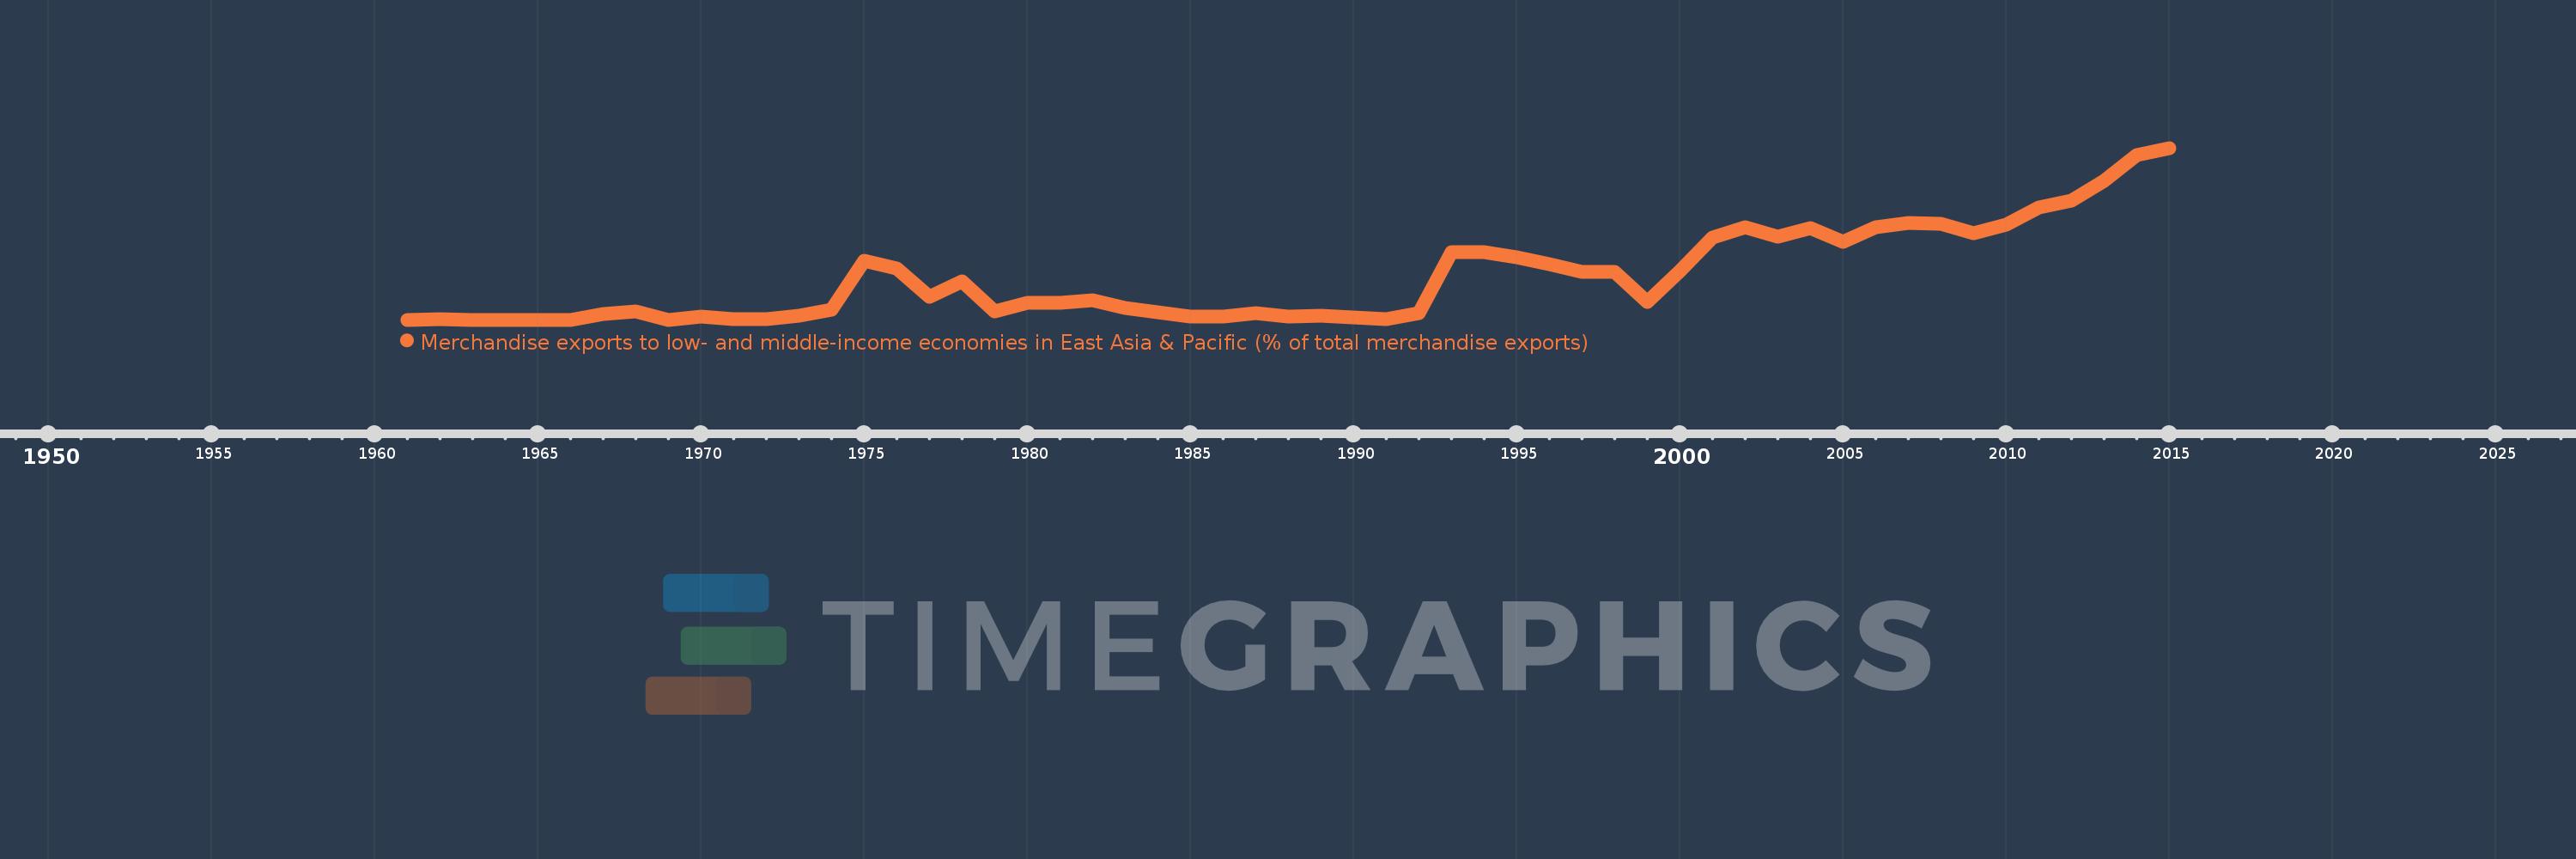
Merchandise exports to low- and middle-income economies in East Asia & Pacific (% of total merchandise exports)
2015,2014,2013,2012,2011,2010,2009,2008,2007,2006,2005,2004,2003,2002,2001,2000,1999,1998,1997,1996,1995,1994,1993,1992,1991,1990,1989,1988,1987,1986,1985,1984,1983,1982,1981,1980,1979,1978,1977,1976,1975,1974,1973,1972,1971,1970,1969,1968,1967,1966,1965,1964,1963,1962,1961
Estas estatísticas em outros países:
AfghanistanAlbaniaAlgeriaArab WorldArgentinaAustraliaAustriaAzerbaijanBahamas, TheBahrainBangladeshBarbadosBelarusBelgiumBermudaBrazilBrunei DarussalamBulgariaCabo VerdeCambodiaCameroonCanadaCaribbean small statesCentral Europe and the BalticsChileChinaColombiaCosta RicaCote d'IvoireCroatiaCubaCyprusCzech RepublicDenmarkDominicaDominican RepublicEarly-demographic dividendEast Asia & PacificEast Asia & Pacific (excluding high income)East Asia & Pacific (IDA & IBRD countries)EcuadorEgypt, Arab Rep.El SalvadorEstoniaEthiopiaEuro areaEurope & Central AsiaEurope & Central Asia (excluding high income)Europe & Central Asia (IDA & IBRD countries)European UnionFijiFinlandFragile and conflict affected situationsFranceGermanyGhanaGreeceGuatemalaGuyanaHeavily indebted poor countries (HIPC)High incomeHondurasHong Kong SAR, ChinaHungaryIBRD onlyIcelandIDA & IBRD totalIDA blendIDA onlyIDA totalIndiaIndonesiaIran, Islamic Rep.IraqIrelandIsraelItalyJamaicaJapanJordanKazakhstanKenyaKorea, Dem. People’s Rep.Korea, Rep.KuwaitLate-demographic dividendLatin America & Caribbean Latin America & Caribbean (excluding high income)Latin America & the Caribbean (IDA & IBRD countries)LatviaLeast developed countries: UN classificationLebanonLithuaniaLow & middle incomeLow incomeLower middle incomeLuxembourgMacao SAR, ChinaMacedonia, FYRMadagascarMalaysiaMaltaMauritiusMexicoMiddle East & North AfricaMiddle East & North Africa (excluding high income)Middle East & North Africa (IDA & IBRD countries)Middle incomeMoldovaMontenegroMoroccoMozambiqueMyanmarNetherlandsNew CaledoniaNew ZealandNigeriaNorth AmericaNorwayOECD membersOmanOther small statesPacific island small statesPakistanPapua New GuineaParaguayPeruPhilippinesPolandPortugalPost-demographic dividendPre-demographic dividendQatarRomaniaRussian FederationSaudi ArabiaSenegalSerbiaSingaporeSlovak RepublicSloveniaSmall statesSolomon IslandsSomaliaSouth AfricaSouth AsiaSouth Asia (IDA & IBRD)SpainSri LankaSt. LuciaSub-Saharan Africa Sub-Saharan Africa (excluding high income)Sub-Saharan Africa (IDA & IBRD countries)SurinameSwedenSwitzerlandSyrian Arab RepublicTanzaniaThailandTogoTongaTrinidad and TobagoTunisiaTurkeyUgandaUkraineUnited Arab EmiratesUnited KingdomUnited StatesUpper middle incomeVenezuela, RBVietnamWorldYemen, Rep.ZambiaZimbabwe Linha do tempo:
Nesta escala de tempo está apresentado um gráfico de 1961 ano até 2015 ano Other small states. Dados de 1960 ano ausente. O número de observações reais por data: 55.
Fonte (nome):
Indicadores de desenvolvimento mundial
Fonte (organização):
World Bank staff estimates based data from International Monetary Fund's Direction of Trade database.
Categorias:
Private Sector, Trade
Foi atualizado:
23 abr 2017 ano
Indicadores de alterações dos valores ao longo dos anos
Máximo:
8.54
1 jan 2015 ano
Na data de observação
Valor
Mudança absoluta
A alteração em relação ao valor anterior
1 jan 1961 ano
0.0
0.0
0.0%
1 jan 1962 ano
0.04
+0.04
%
1 jan 1963 ano
0.0
-0.04
-100.0%
1 jan 1967 ano
0.274
+0.274
%
1 jan 1968 ano
0.406
+0.132
48.17%
1 jan 1969 ano
0.0
-0.406
-100.0%
1 jan 1970 ano
0.139
+0.139
%
1 jan 1971 ano
0.038
-0.1
-72.31%
1 jan 1972 ano
0.009
-0.03
-77.0%
1 jan 1973 ano
0.202
+0.194
2.19 mil%
1 jan 1974 ano
0.512
+0.309
152.88%
1 jan 1975 ano
2.946
+2.434
475.6%
1 jan 1976 ano
2.555
-0.391
-13.26%
1 jan 1977 ano
1.15
-1.405
-54.99%
1 jan 1978 ano
1.897
+0.746
64.88%
1 jan 1979 ano
0.399
-1.498
-78.97%
1 jan 1980 ano
0.859
+0.46
115.31%
1 jan 1981 ano
0.837
-0.022
-2.59%
1 jan 1982 ano
0.962
+0.125
14.96%
1 jan 1983 ano
0.604
-0.358
-37.23%
1 jan 1984 ano
0.382
-0.222
-36.73%
1 jan 1985 ano
0.16
-0.222
-58.07%
1 jan 1986 ano
0.156
-0.004
-2.35%
1 jan 1987 ano
0.325
+0.169
107.8%
1 jan 1988 ano
0.17
-0.154
-47.54%
1 jan 1989 ano
0.186
+0.015
8.9%
1 jan 1990 ano
0.109
-0.076
-41.05%
1 jan 1991 ano
0.046
-0.063
-57.65%
1 jan 1992 ano
0.311
+0.265
571.19%
1 jan 1993 ano
3.375
+3.064
985.16%
1 jan 1994 ano
3.377
+0.003
0.08%
1 jan 1995 ano
3.098
-0.28
-8.28%
1 jan 1996 ano
2.742
-0.355
-11.47%
1 jan 1997 ano
2.36
-0.382
-13.93%
1 jan 1998 ano
2.398
+0.038
1.59%
1 jan 1999 ano
0.885
-1.513
-63.11%
1 jan 2000 ano
2.409
+1.525
172.37%
1 jan 2001 ano
4.07
+1.661
68.92%
1 jan 2002 ano
4.593
+0.523
12.84%
1 jan 2003 ano
4.134
-0.459
-9.99%
1 jan 2004 ano
4.554
+0.42
10.17%
1 jan 2005 ano
3.862
-0.692
-15.2%
1 jan 2006 ano
4.595
+0.732
18.96%
1 jan 2007 ano
4.791
+0.197
4.28%
1 jan 2008 ano
4.774
-0.017
-0.36%
1 jan 2009 ano
4.28
-0.494
-10.35%
1 jan 2010 ano
4.714
+0.434
10.14%
1 jan 2011 ano
5.579
+0.866
18.36%
1 jan 2012 ano
5.939
+0.36
6.45%
1 jan 2013 ano
6.902
+0.963
16.21%
1 jan 2014 ano
8.2
+1.299
18.82%
1 jan 2015 ano
8.54
+0.339
4.14%
Classificação de países por estatísticas atuais por anos


Comentários: