29
/pt/
pt
AIzaSyAYiBZKx7MnpbEhh9jyipgxe19OcubqV5w
April 1, 2024
158651
Iraq
IRQ
true
2
1
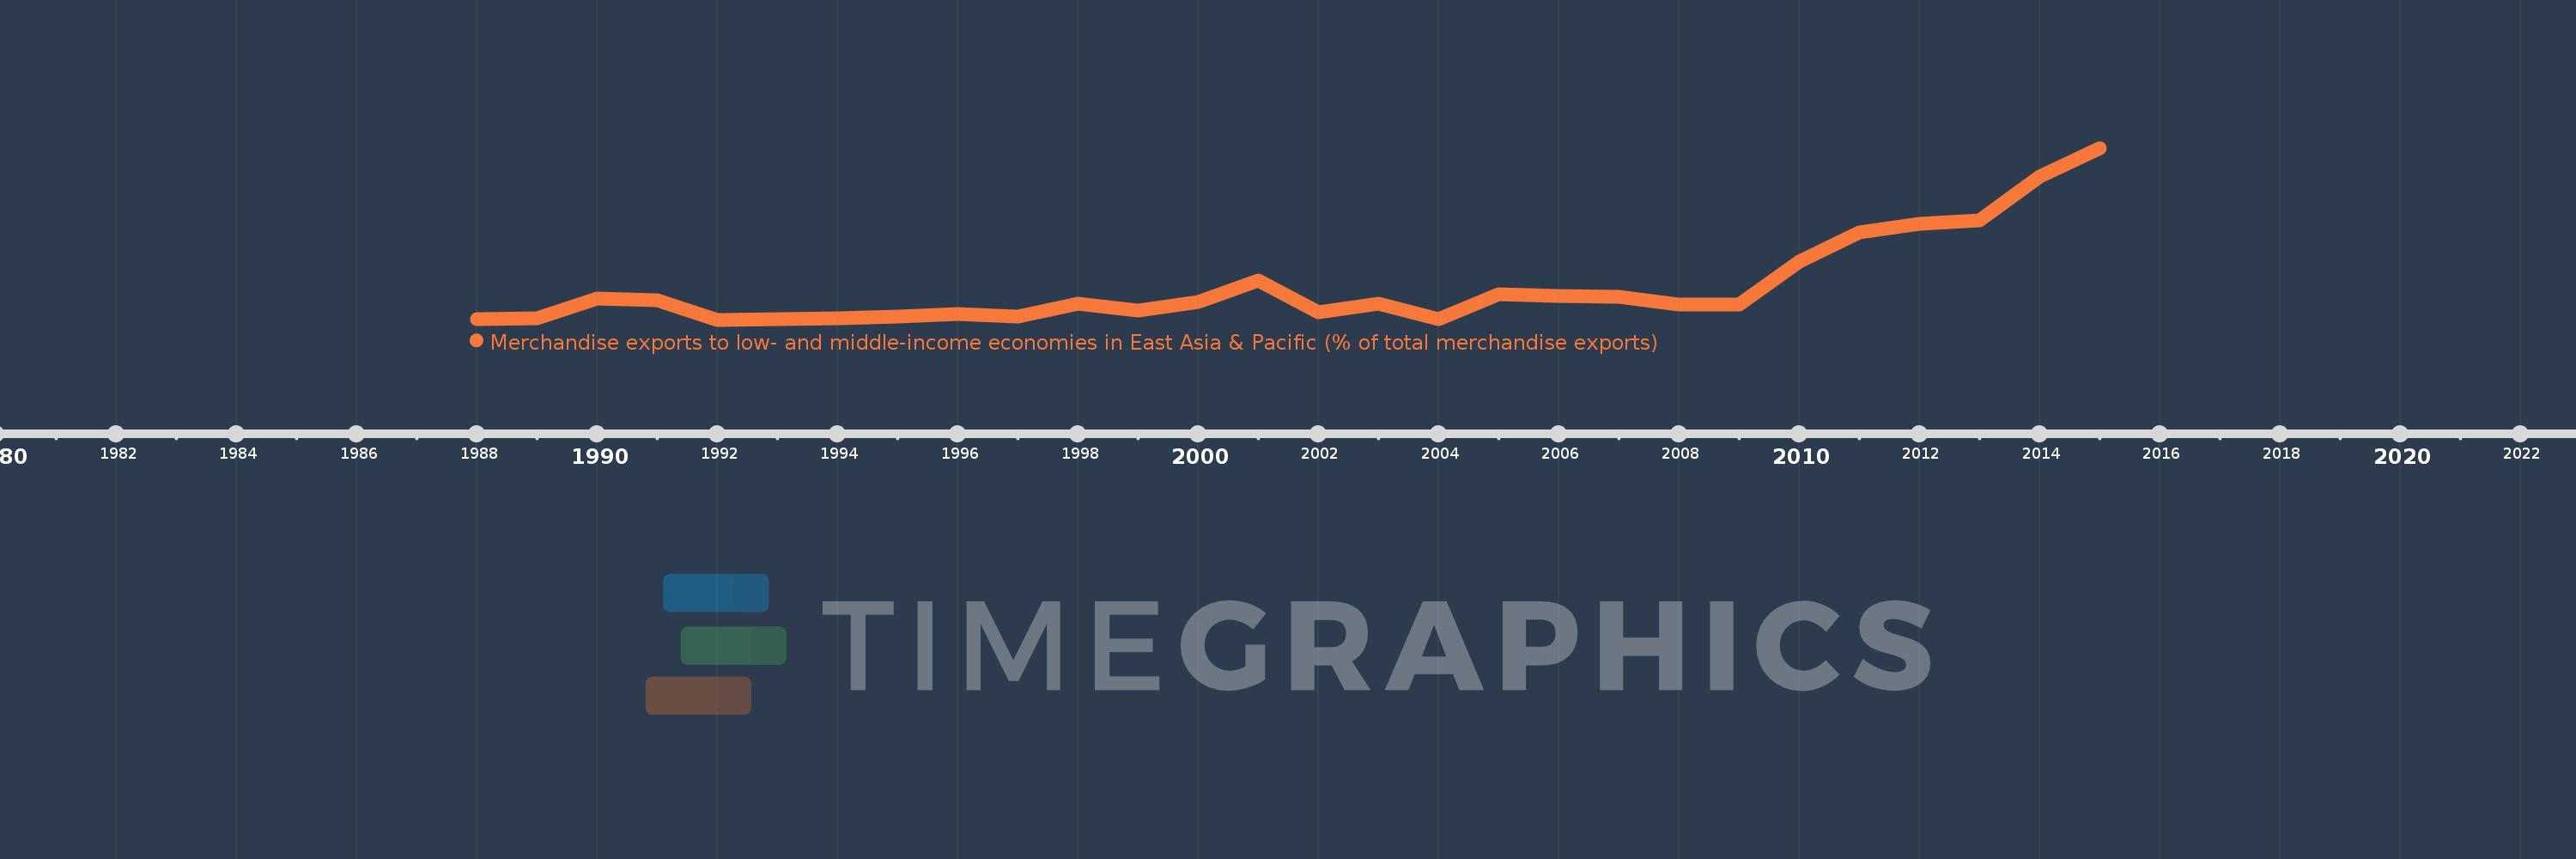
Merchandise exports to low- and middle-income economies in East Asia & Pacific (% of total merchandise exports)
2015,2014,2013,2012,2011,2010,2009,2008,2007,2006,2005,2004,2003,2002,2001,2000,1999,1998,1997,1996,1995,1994,1993,1992,1991,1990,1989,1988
Estas estatísticas em outros países:
AfghanistanAlbaniaAlgeriaArab WorldArgentinaAustraliaAustriaAzerbaijanBahamas, TheBahrainBangladeshBarbadosBelarusBelgiumBermudaBrazilBrunei DarussalamBulgariaCabo VerdeCambodiaCameroonCanadaCaribbean small statesCentral Europe and the BalticsChileChinaColombiaCosta RicaCote d'IvoireCroatiaCubaCyprusCzech RepublicDenmarkDominicaDominican RepublicEarly-demographic dividendEast Asia & PacificEast Asia & Pacific (excluding high income)East Asia & Pacific (IDA & IBRD countries)EcuadorEgypt, Arab Rep.El SalvadorEstoniaEthiopiaEuro areaEurope & Central AsiaEurope & Central Asia (excluding high income)Europe & Central Asia (IDA & IBRD countries)European UnionFijiFinlandFragile and conflict affected situationsFranceGermanyGhanaGreeceGuatemalaGuyanaHeavily indebted poor countries (HIPC)High incomeHondurasHong Kong SAR, ChinaHungaryIBRD onlyIcelandIDA & IBRD totalIDA blendIDA onlyIDA totalIndiaIndonesiaIran, Islamic Rep.IraqIrelandIsraelItalyJamaicaJapanJordanKazakhstanKenyaKorea, Dem. People’s Rep.Korea, Rep.KuwaitLate-demographic dividendLatin America & Caribbean Latin America & Caribbean (excluding high income)Latin America & the Caribbean (IDA & IBRD countries)LatviaLeast developed countries: UN classificationLebanonLithuaniaLow & middle incomeLow incomeLower middle incomeLuxembourgMacao SAR, ChinaMacedonia, FYRMadagascarMalaysiaMaltaMauritiusMexicoMiddle East & North AfricaMiddle East & North Africa (excluding high income)Middle East & North Africa (IDA & IBRD countries)Middle incomeMoldovaMontenegroMoroccoMozambiqueMyanmarNetherlandsNew CaledoniaNew ZealandNigeriaNorth AmericaNorwayOECD membersOmanOther small statesPacific island small statesPakistanPapua New GuineaParaguayPeruPhilippinesPolandPortugalPost-demographic dividendPre-demographic dividendQatarRomaniaRussian FederationSaudi ArabiaSenegalSerbiaSingaporeSlovak RepublicSloveniaSmall statesSolomon IslandsSomaliaSouth AfricaSouth AsiaSouth Asia (IDA & IBRD)SpainSri LankaSt. LuciaSub-Saharan Africa Sub-Saharan Africa (excluding high income)Sub-Saharan Africa (IDA & IBRD countries)SurinameSwedenSwitzerlandSyrian Arab RepublicTanzaniaThailandTogoTongaTrinidad and TobagoTunisiaTurkeyUgandaUkraineUnited Arab EmiratesUnited KingdomUnited StatesUpper middle incomeVenezuela, RBVietnamWorldYemen, Rep.ZambiaZimbabwe Linha do tempo:
Nesta escala de tempo está apresentado um gráfico de 1988 ano até 2015 ano Iraq. Dados de 1987 ano ausente. O número de observações reais por data: 28.
Fonte (nome):
Indicadores de desenvolvimento mundial
Fonte (organização):
World Bank staff estimates based data from International Monetary Fund's Direction of Trade database.
Categorias:
Private Sector, Trade
Foi atualizado:
23 abr 2017 ano
Indicadores de alterações dos valores ao longo dos anos
Mínimo:
0.164
1 jan 1992 ano
Máximo:
24.006
1 jan 2015 ano
Na data de observação
Valor
Mudança absoluta
A alteração em relação ao valor anterior
1 jan 1988 ano
0.25
+0.25
0.0%
1 jan 1989 ano
0.313
+0.062
24.91%
1 jan 1990 ano
3.061
+2.748
878.73%
1 jan 1991 ano
2.873
-0.188
-6.14%
1 jan 1992 ano
0.164
-2.709
-94.29%
1 jan 1993 ano
0.252
+0.088
53.65%
1 jan 1994 ano
0.409
+0.158
62.57%
1 jan 1995 ano
0.651
+0.242
59.07%
1 jan 1996 ano
0.931
+0.28
43.0%
1 jan 1997 ano
0.623
-0.309
-33.14%
1 jan 1998 ano
2.452
+1.829
293.69%
1 jan 1999 ano
1.499
-0.953
-38.85%
1 jan 2000 ano
2.628
+1.129
75.27%
1 jan 2001 ano
5.59
+2.962
112.72%
1 jan 2002 ano
1.242
-4.348
-77.78%
1 jan 2003 ano
2.386
+1.145
92.16%
1 jan 2004 ano
0.298
-2.088
-87.5%
1 jan 2005 ano
3.76
+3.462
1.16 mil%
1 jan 2006 ano
3.485
-0.275
-7.31%
1 jan 2007 ano
3.376
-0.109
-3.12%
1 jan 2008 ano
2.247
-1.129
-33.44%
1 jan 2009 ano
2.221
-0.026
-1.14%
1 jan 2010 ano
8.274
+6.053
272.47%
1 jan 2011 ano
12.256
+3.982
48.12%
1 jan 2012 ano
13.484
+1.228
10.02%
1 jan 2013 ano
13.928
+0.444
3.29%
1 jan 2014 ano
19.998
+6.07
43.58%
1 jan 2015 ano
24.006
+4.008
20.04%
Classificação de países por estatísticas atuais por anos


Comentários: