29
/pt/
pt
AIzaSyAYiBZKx7MnpbEhh9jyipgxe19OcubqV5w
April 1, 2024
53198
Other small states
OSS
false
2
1
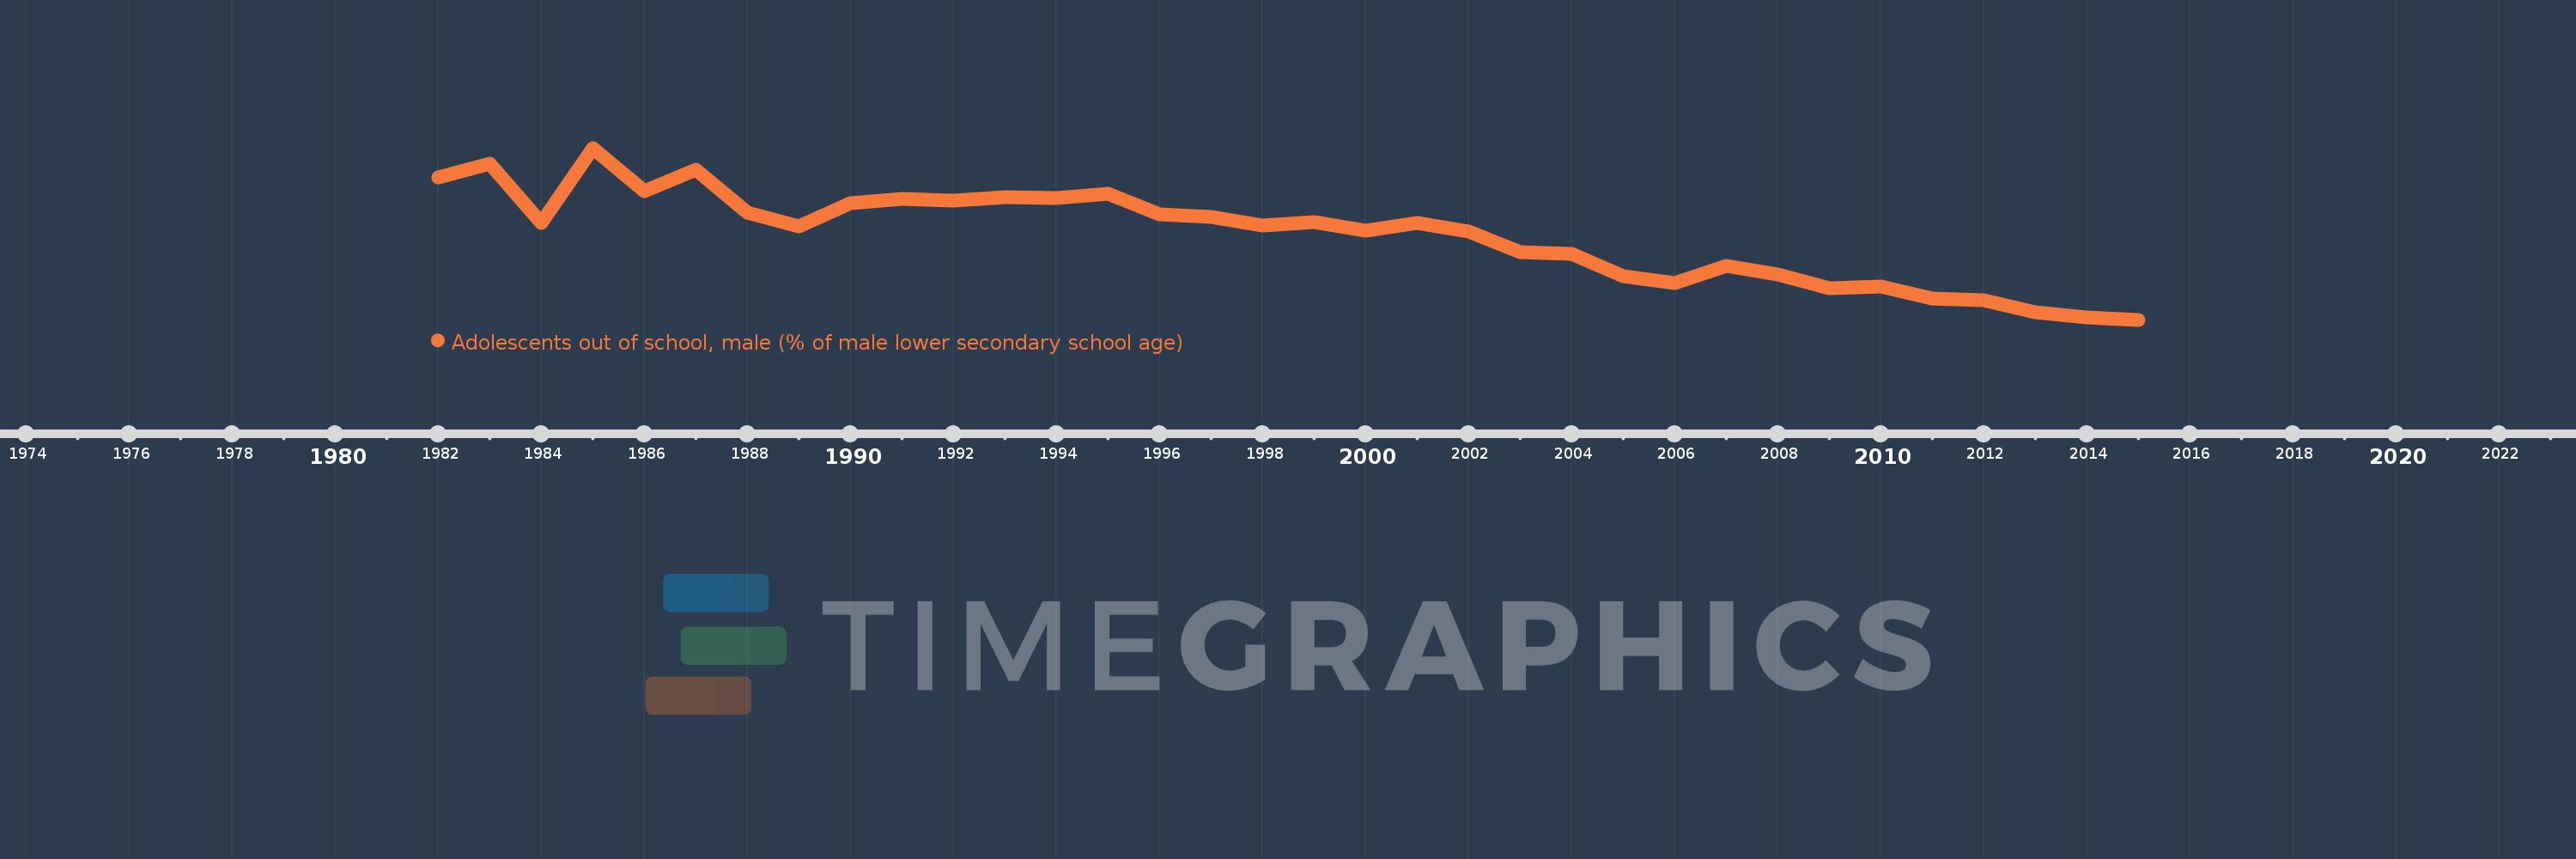
Adolescents out of school, male (% of male lower secondary school age)
2015,2014,2013,2012,2011,2010,2009,2008,2007,2006,2005,2004,2003,2002,2001,2000,1999,1998,1997,1996,1995,1994,1993,1992,1991,1990,1989,1988,1987,1986,1985,1984,1983,1982
Estas estatísticas em outros países:
AfghanistanAlbaniaAlgeriaAngolaAntigua and BarbudaArab WorldArgentinaArmeniaArubaAustraliaAzerbaijanBahamas, TheBahrainBangladeshBarbadosBelarusBelgiumBelizeBeninBermudaBhutanBoliviaBotswanaBrazilBrunei DarussalamBulgariaBurkina FasoBurundiCabo VerdeCambodiaCameroonCanadaCaribbean small statesCentral African RepublicCentral Europe and the BalticsChadChileColombiaComorosCongo, Dem. Rep.Congo, Rep.Costa RicaCroatiaCubaCyprusDenmarkDjiboutiDominicaDominican RepublicEarly-demographic dividendEast Asia & PacificEast Asia & Pacific (excluding high income)East Asia & Pacific (IDA & IBRD countries)EcuadorEgypt, Arab Rep.El SalvadorEritreaEstoniaEthiopiaEuro areaEurope & Central AsiaEurope & Central Asia (excluding high income)Europe & Central Asia (IDA & IBRD countries)European UnionFijiFinlandFragile and conflict affected situationsFranceGambia, TheGeorgiaGhanaGreeceGrenadaGuatemalaGuineaGuinea-BissauGuyanaHeavily indebted poor countries (HIPC)High incomeHondurasHong Kong SAR, ChinaHungaryIBRD onlyIcelandIDA & IBRD totalIDA blendIDA onlyIDA totalIndiaIndonesiaIran, Islamic Rep.IraqIrelandItalyJamaicaJordanKazakhstanKenyaKiribatiKorea, Rep.KuwaitKyrgyz RepublicLao PDRLate-demographic dividendLatin America & Caribbean Latin America & Caribbean (excluding high income)Latin America & the Caribbean (IDA & IBRD countries)LatviaLeast developed countries: UN classificationLebanonLesothoLibyaLiechtensteinLithuaniaLow & middle incomeLow incomeLower middle incomeLuxembourgMacao SAR, ChinaMacedonia, FYRMadagascarMalawiMaldivesMaliMaltaMauritaniaMauritiusMexicoMiddle East & North AfricaMiddle East & North Africa (excluding high income)Middle East & North Africa (IDA & IBRD countries)Middle incomeMoldovaMongoliaMoroccoMozambiqueMyanmarNamibiaNauruNetherlandsNew ZealandNicaraguaNigerNorth AmericaNorwayOECD membersOmanOther small statesPacific island small statesPakistanPanamaParaguayPeruPhilippinesPolandPortugalPost-demographic dividendPre-demographic dividendPuerto RicoQatarRomaniaRussian FederationSamoaSao Tome and PrincipeSaudi ArabiaSenegalSerbiaSeychellesSierra LeoneSloveniaSmall statesSolomon IslandsSomaliaSouth AfricaSouth AsiaSouth Asia (IDA & IBRD)SpainSri LankaSt. Kitts and NevisSt. LuciaSt. Vincent and the GrenadinesSub-Saharan Africa Sub-Saharan Africa (excluding high income)Sub-Saharan Africa (IDA & IBRD countries)SudanSurinameSwazilandSwedenSwitzerlandSyrian Arab RepublicTajikistanThailandTimor-LesteTogoTongaTrinidad and TobagoTunisiaTurkeyTuvaluUgandaUkraineUnited Arab EmiratesUnited KingdomUnited StatesUpper middle incomeUruguayVanuatuVenezuela, RBWest Bank and GazaWorldYemen, Rep.Zimbabwe Linha do tempo:
Nesta escala de tempo está apresentado um gráfico de 1982 ano até 2015 ano Other small states. Dados de 1981 ano ausente. O número de observações reais por data: 34.
Fonte (nome):
Indicadores de desenvolvimento mundial
Fonte (organização):
United Nations Educational, Scientific, and Cultural Organization (UNESCO) Institute for Statistics.
Categorias:
Education
Foi atualizado:
23 abr 2017 ano
Indicadores de alterações dos valores ao longo dos anos
Mínimo:
17.105
1 jan 2015 ano
Máximo:
27.512
1 jan 1985 ano
Na data de observação
Valor
Mudança absoluta
A alteração em relação ao valor anterior
1 jan 1982 ano
25.706
+25.706
0.0%
1 jan 1983 ano
26.584
+0.878
3.42%
1 jan 1984 ano
22.977
-3.607
-13.57%
1 jan 1985 ano
27.512
+4.535
19.74%
1 jan 1986 ano
24.885
-2.627
-9.55%
1 jan 1987 ano
26.189
+1.304
5.24%
1 jan 1988 ano
23.584
-2.605
-9.95%
1 jan 1989 ano
22.787
-0.797
-3.38%
1 jan 1990 ano
24.187
+1.4
6.15%
1 jan 1991 ano
24.401
+0.214
0.89%
1 jan 1992 ano
24.324
-0.077
-0.32%
1 jan 1993 ano
24.525
+0.201
0.82%
1 jan 1994 ano
24.465
-0.06
-0.24%
1 jan 1995 ano
24.743
+0.278
1.13%
1 jan 1996 ano
23.495
-1.248
-5.04%
1 jan 1997 ano
23.323
-0.172
-0.73%
1 jan 1998 ano
22.791
-0.531
-2.28%
1 jan 1999 ano
23.026
+0.235
1.03%
1 jan 2000 ano
22.476
-0.55
-2.39%
1 jan 2001 ano
22.982
+0.506
2.25%
1 jan 2002 ano
22.47
-0.512
-2.23%
1 jan 2003 ano
21.197
-1.273
-5.67%
1 jan 2004 ano
21.078
-0.119
-0.56%
1 jan 2005 ano
19.746
-1.332
-6.32%
1 jan 2006 ano
19.338
-0.407
-2.06%
1 jan 2007 ano
20.391
+1.053
5.44%
1 jan 2008 ano
19.859
-0.532
-2.61%
1 jan 2009 ano
19.007
-0.853
-4.29%
1 jan 2010 ano
19.117
+0.11
0.58%
1 jan 2011 ano
18.373
-0.744
-3.89%
1 jan 2012 ano
18.297
-0.076
-0.41%
1 jan 2013 ano
17.536
-0.761
-4.16%
1 jan 2014 ano
17.233
-0.303
-1.73%
1 jan 2015 ano
17.105
-0.128
-0.74%
Classificação de países por estatísticas atuais por anos


Comentários: