29
/pt/
pt
AIzaSyAYiBZKx7MnpbEhh9jyipgxe19OcubqV5w
April 1, 2024
181819
Luxembourg
LUX
true
2
1
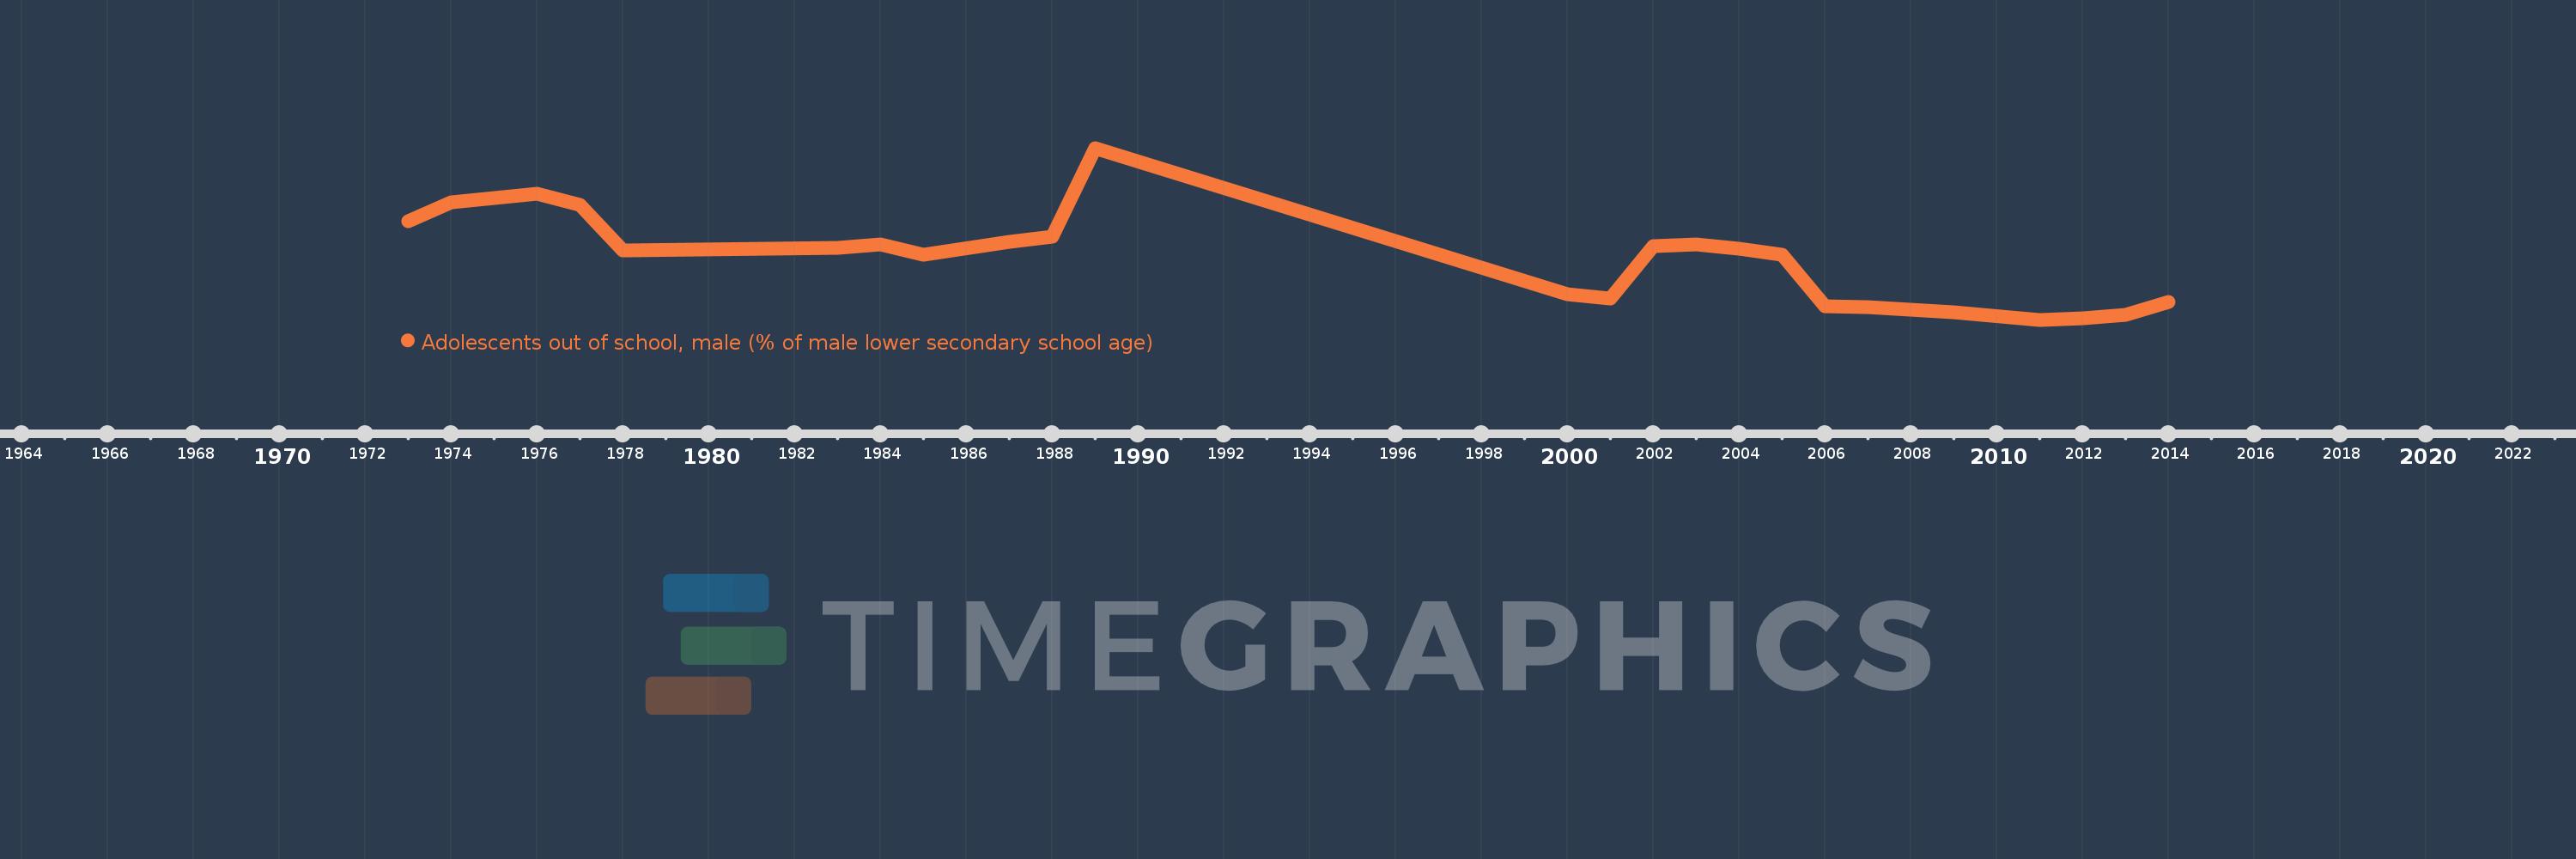
Adolescents out of school, male (% of male lower secondary school age)
2014,2013,2012,2011,2009,2008,2007,2006,2005,2004,2003,2002,2001,2000,1989,1988,1987,1985,1984,1983,1978,1977,1976,1975,1974,1973
Estas estatísticas em outros países:
AfghanistanAlbaniaAlgeriaAngolaAntigua and BarbudaArab WorldArgentinaArmeniaArubaAustraliaAzerbaijanBahamas, TheBahrainBangladeshBarbadosBelarusBelgiumBelizeBeninBermudaBhutanBoliviaBotswanaBrazilBrunei DarussalamBulgariaBurkina FasoBurundiCabo VerdeCambodiaCameroonCanadaCaribbean small statesCentral African RepublicCentral Europe and the BalticsChadChileColombiaComorosCongo, Dem. Rep.Congo, Rep.Costa RicaCroatiaCubaCyprusDenmarkDjiboutiDominicaDominican RepublicEarly-demographic dividendEast Asia & PacificEast Asia & Pacific (excluding high income)East Asia & Pacific (IDA & IBRD countries)EcuadorEgypt, Arab Rep.El SalvadorEritreaEstoniaEthiopiaEuro areaEurope & Central AsiaEurope & Central Asia (excluding high income)Europe & Central Asia (IDA & IBRD countries)European UnionFijiFinlandFragile and conflict affected situationsFranceGambia, TheGeorgiaGhanaGreeceGrenadaGuatemalaGuineaGuinea-BissauGuyanaHeavily indebted poor countries (HIPC)High incomeHondurasHong Kong SAR, ChinaHungaryIBRD onlyIcelandIDA & IBRD totalIDA blendIDA onlyIDA totalIndiaIndonesiaIran, Islamic Rep.IraqIrelandItalyJamaicaJordanKazakhstanKenyaKiribatiKorea, Rep.KuwaitKyrgyz RepublicLao PDRLate-demographic dividendLatin America & Caribbean Latin America & Caribbean (excluding high income)Latin America & the Caribbean (IDA & IBRD countries)LatviaLeast developed countries: UN classificationLebanonLesothoLibyaLiechtensteinLithuaniaLow & middle incomeLow incomeLower middle incomeLuxembourgMacao SAR, ChinaMacedonia, FYRMadagascarMalawiMaldivesMaliMaltaMauritaniaMauritiusMexicoMiddle East & North AfricaMiddle East & North Africa (excluding high income)Middle East & North Africa (IDA & IBRD countries)Middle incomeMoldovaMongoliaMoroccoMozambiqueMyanmarNamibiaNauruNetherlandsNew ZealandNicaraguaNigerNorth AmericaNorwayOECD membersOmanOther small statesPacific island small statesPakistanPanamaParaguayPeruPhilippinesPolandPortugalPost-demographic dividendPre-demographic dividendPuerto RicoQatarRomaniaRussian FederationSamoaSao Tome and PrincipeSaudi ArabiaSenegalSerbiaSeychellesSierra LeoneSloveniaSmall statesSolomon IslandsSomaliaSouth AfricaSouth AsiaSouth Asia (IDA & IBRD)SpainSri LankaSt. Kitts and NevisSt. LuciaSt. Vincent and the GrenadinesSub-Saharan Africa Sub-Saharan Africa (excluding high income)Sub-Saharan Africa (IDA & IBRD countries)SudanSurinameSwazilandSwedenSwitzerlandSyrian Arab RepublicTajikistanThailandTimor-LesteTogoTongaTrinidad and TobagoTunisiaTurkeyTuvaluUgandaUkraineUnited Arab EmiratesUnited KingdomUnited StatesUpper middle incomeUruguayVanuatuVenezuela, RBWest Bank and GazaWorldYemen, Rep.Zimbabwe Linha do tempo:
Nesta escala de tempo está apresentado um gráfico de 1973 ano até 2014 ano Luxembourg. Dados de 1972 ano ausente. O número de observações reais por data: 26.
Fonte (nome):
Indicadores de desenvolvimento mundial
Fonte (organização):
United Nations Educational, Scientific, and Cultural Organization (UNESCO) Institute for Statistics.
Categorias:
Education
Foi atualizado:
23 abr 2017 ano
Indicadores de alterações dos valores ao longo dos anos
Mínimo:
2.951
1 jan 2011 ano
Máximo:
32.301
1 jan 1989 ano
Na data de observação
Valor
Mudança absoluta
A alteração em relação ao valor anterior
1 jan 1973 ano
19.828
+19.828
0.0%
1 jan 1974 ano
23.065
+3.238
16.33%
1 jan 1975 ano
23.798
+0.733
3.18%
1 jan 1976 ano
24.495
+0.696
2.93%
1 jan 1977 ano
22.555
-1.94
-7.92%
1 jan 1978 ano
14.842
-7.713
-34.2%
1 jan 1983 ano
15.223
+0.381
2.57%
1 jan 1984 ano
15.812
+0.589
3.87%
1 jan 1985 ano
14.044
-1.768
-11.18%
1 jan 1987 ano
16.325
+2.281
16.24%
1 jan 1988 ano
17.123
+0.798
4.89%
1 jan 1989 ano
32.301
+15.179
88.65%
1 jan 2000 ano
7.361
-24.94
-77.21%
1 jan 2001 ano
6.511
-0.85
-11.54%
1 jan 2002 ano
15.492
+8.98
137.92%
1 jan 2003 ano
15.851
+0.359
2.32%
1 jan 2004 ano
15.112
-0.74
-4.67%
1 jan 2005 ano
14.007
-1.105
-7.31%
1 jan 2006 ano
5.23
-8.777
-62.66%
1 jan 2007 ano
5.123
-0.108
-2.06%
1 jan 2008 ano
4.63
-0.493
-9.62%
1 jan 2009 ano
4.214
-0.416
-8.98%
1 jan 2011 ano
2.951
-1.263
-29.97%
1 jan 2012 ano
3.215
+0.264
8.96%
1 jan 2013 ano
3.84
+0.625
19.42%
1 jan 2014 ano
6.041
+2.201
57.31%
Classificação de países por estatísticas atuais por anos


Comentários: