29
/pt/
pt
AIzaSyAYiBZKx7MnpbEhh9jyipgxe19OcubqV5w
April 1, 2024
52889
OECD members
OED
false
2
1
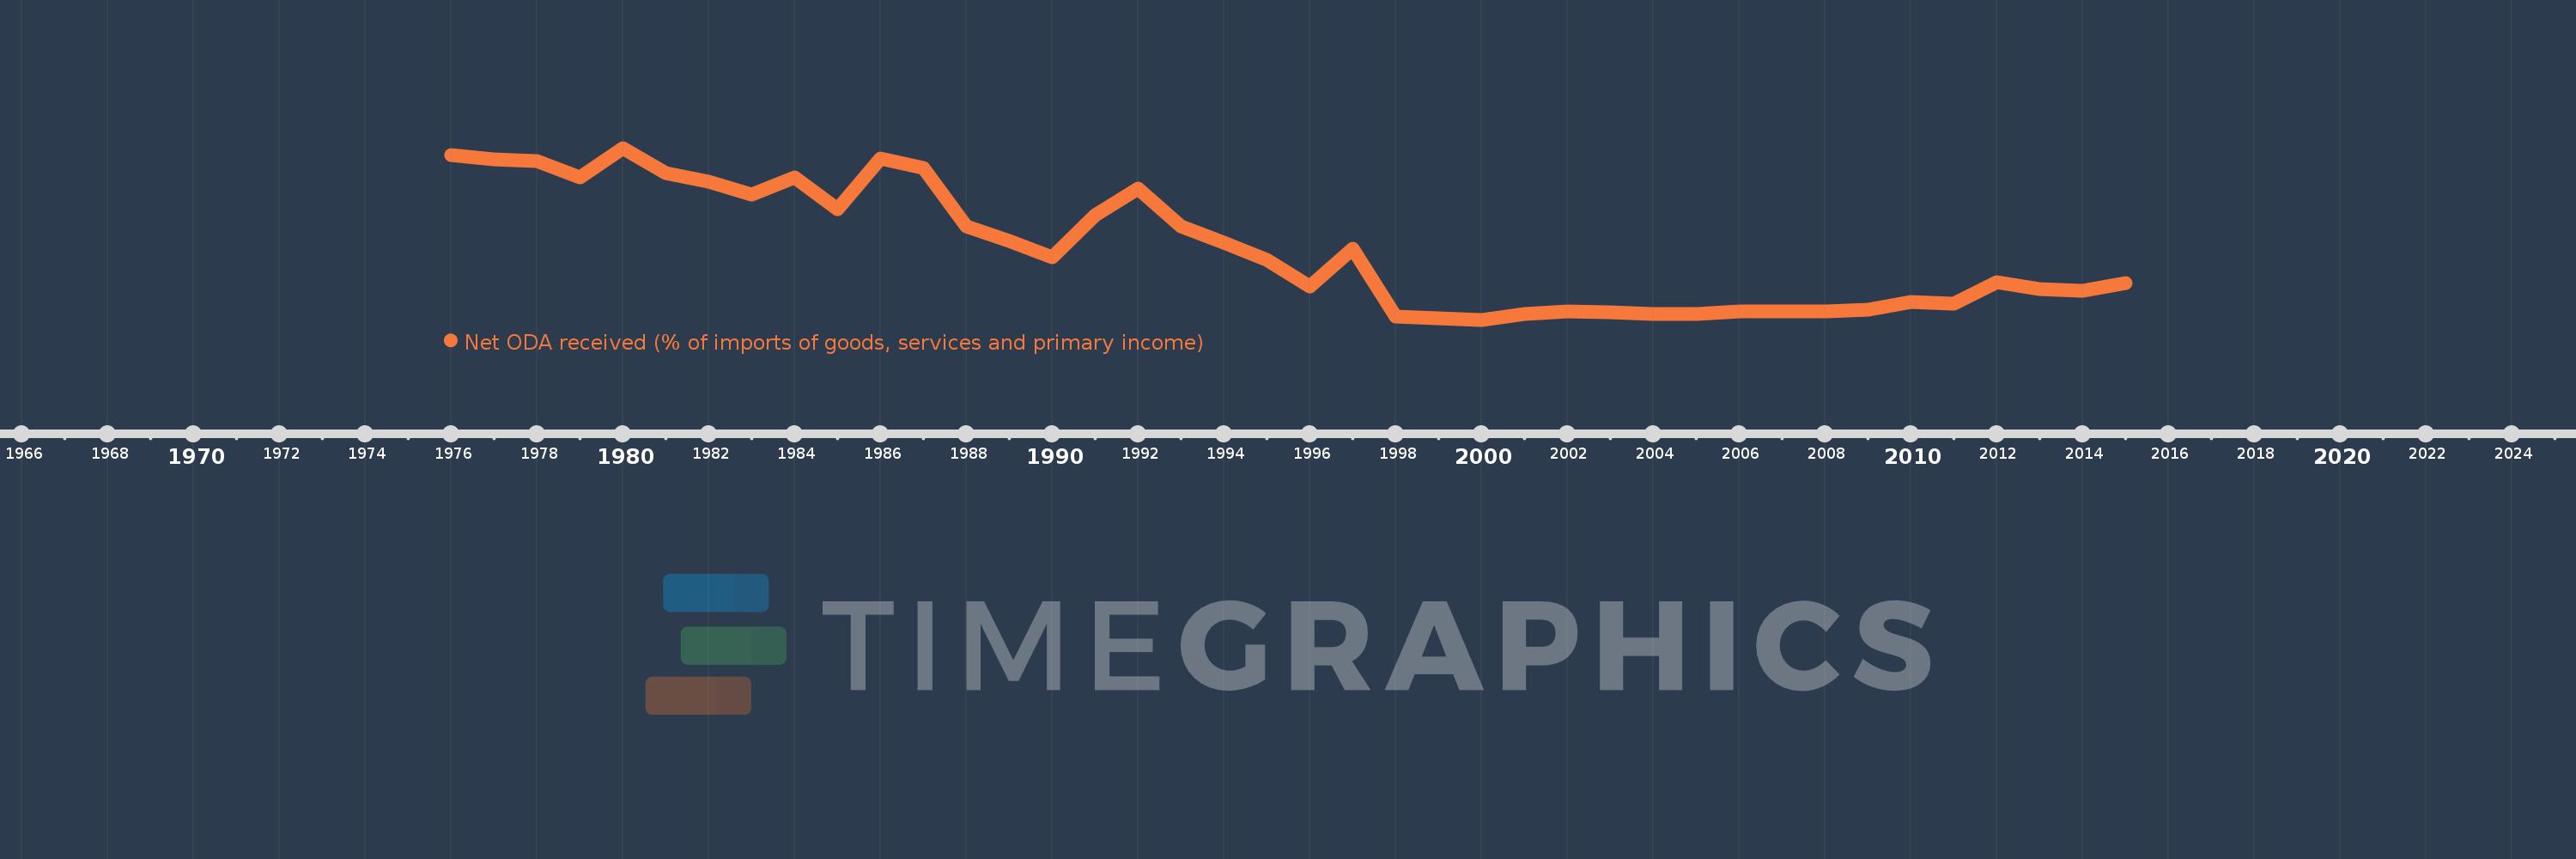
Net ODA received (% of imports of goods, services and primary income)
2015,2014,2013,2012,2011,2010,2009,2008,2007,2006,2005,2004,2003,2002,2001,2000,1999,1998,1997,1996,1995,1994,1993,1992,1991,1990,1989,1988,1987,1986,1985,1984,1983,1982,1981,1980,1979,1978,1977,1976
Estas estatísticas em outros países:
AfghanistanAlbaniaAlgeriaAngolaAntigua and BarbudaArab WorldArgentinaArmeniaArubaAzerbaijanBahamas, TheBahrainBangladeshBarbadosBelarusBelizeBeninBhutanBoliviaBosnia and HerzegovinaBotswanaBrazilBurkina FasoBurundiCabo VerdeCambodiaCameroonCaribbean small statesCentral African RepublicCentral Europe and the BalticsChadChileChinaColombiaComorosCongo, Dem. Rep.Congo, Rep.Costa RicaCote d'IvoireCroatiaCyprusDjiboutiDominicaDominican RepublicEast Asia & PacificEast Asia & Pacific (excluding high income)East Asia & Pacific (IDA & IBRD countries)EcuadorEgypt, Arab Rep.El SalvadorEquatorial GuineaEritreaEthiopiaEuro areaEurope & Central AsiaEurope & Central Asia (excluding high income)Europe & Central Asia (IDA & IBRD countries)European UnionFijiFragile and conflict affected situationsGabonGambia, TheGeorgiaGhanaGrenadaGuatemalaGuineaGuinea-BissauGuyanaHaitiHeavily indebted poor countries (HIPC)High incomeHondurasIBRD onlyIDA & IBRD totalIDA blendIDA onlyIDA totalIndiaIndonesiaIran, Islamic Rep.IraqIsraelJamaicaJordanKazakhstanKenyaKiribatiKorea, Rep.KosovoKuwaitKyrgyz RepublicLao PDRLatin America & Caribbean Latin America & Caribbean (excluding high income)Latin America & the Caribbean (IDA & IBRD countries)Least developed countries: UN classificationLebanonLesothoLiberiaLibyaLow & middle incomeLow incomeLower middle incomeMacedonia, FYRMadagascarMalawiMalaysiaMaldivesMaliMaltaMarshall IslandsMauritaniaMauritiusMexicoMicronesia, Fed. Sts.Middle East & North Africa (excluding high income)Middle East & North Africa (IDA & IBRD countries)Middle incomeMoldovaMongoliaMontenegroMoroccoMozambiqueMyanmarNamibiaNepalNicaraguaNigerNigeriaNorth AmericaOECD membersOmanOther small statesPacific island small statesPakistanPalauPanamaPapua New GuineaParaguayPeruPhilippinesRwandaSamoaSao Tome and PrincipeSaudi ArabiaSenegalSerbiaSeychellesSierra LeoneSingaporeSloveniaSmall statesSolomon IslandsSouth AfricaSouth AsiaSouth Asia (IDA & IBRD)South SudanSri LankaSt. Kitts and NevisSt. LuciaSt. Vincent and the GrenadinesSub-Saharan Africa Sub-Saharan Africa (excluding high income)Sub-Saharan Africa (IDA & IBRD countries)SudanSurinameSwazilandSyrian Arab RepublicTajikistanTanzaniaThailandTimor-LesteTogoTongaTrinidad and TobagoTunisiaTurkeyTuvaluUgandaUkraineUpper middle incomeUruguayVanuatuVenezuela, RBVietnamWest Bank and GazaWorldYemen, Rep.ZambiaZimbabwe Linha do tempo:
Nesta escala de tempo está apresentado um gráfico de 1976 ano até 2015 ano OECD members. Dados de 1975 ano ausente. O número de observações reais por data: 40.
Fonte (nome):
Indicadores de desenvolvimento mundial
Fonte (organização):
Development Assistance Committee of the Organisation for Economic Co-operation and Development, Geographical Distribution of Financial Flows to Developing Countries, Development Co-operation Report, and International Development Statistics database. Data are available online at: www.oecd.org/dac/stats/idsonline. World Bank imports of good and services estimates are used for the denominator.
Categorias:
Aid Effectiveness
Foi atualizado:
23 abr 2017 ano
Indicadores de alterações dos valores ao longo dos anos
Mínimo:
0.001
1 jan 2000 ano
Máximo:
0.119
1 jan 1980 ano
Na data de observação
Valor
Mudança absoluta
A alteração em relação ao valor anterior
1 jan 1976 ano
0.114
+0.114
0.0%
1 jan 1977 ano
0.111
-0.003
-2.64%
1 jan 1978 ano
0.11
-0.001
-1.08%
1 jan 1979 ano
0.099
-0.011
-9.79%
1 jan 1980 ano
0.119
+0.02
19.7%
1 jan 1981 ano
0.102
-0.017
-14.09%
1 jan 1982 ano
0.096
-0.006
-6.15%
1 jan 1983 ano
0.087
-0.009
-8.9%
1 jan 1984 ano
0.099
+0.012
13.8%
1 jan 1985 ano
0.077
-0.023
-22.9%
1 jan 1986 ano
0.112
+0.036
46.58%
1 jan 1987 ano
0.105
-0.007
-6.09%
1 jan 1988 ano
0.065
-0.041
-38.59%
1 jan 1989 ano
0.055
-0.01
-15.58%
1 jan 1990 ano
0.044
-0.011
-19.34%
1 jan 1991 ano
0.073
+0.029
65.35%
1 jan 1992 ano
0.091
+0.018
25.36%
1 jan 1993 ano
0.065
-0.026
-28.98%
1 jan 1994 ano
0.054
-0.011
-17.38%
1 jan 1995 ano
0.042
-0.012
-22.46%
1 jan 1996 ano
0.024
-0.018
-42.95%
1 jan 1997 ano
0.05
+0.026
110.56%
1 jan 1998 ano
0.003
-0.047
-94.21%
1 jan 1999 ano
0.002
-0.001
-18.93%
1 jan 2000 ano
0.001
-0.001
-39.37%
1 jan 2001 ano
0.005
+0.004
268.65%
1 jan 2002 ano
0.007
+0.001
24.67%
1 jan 2003 ano
0.006
0.0
-2.43%
1 jan 2004 ano
0.005
-0.002
-27.67%
1 jan 2005 ano
0.005
0.0
-0.86%
1 jan 2006 ano
0.007
+0.002
45.24%
1 jan 2007 ano
0.007
+0.001
8.32%
1 jan 2008 ano
0.007
-0.001
-8.09%
1 jan 2009 ano
0.008
+0.002
24.72%
1 jan 2010 ano
0.013
+0.005
55.6%
1 jan 2011 ano
0.012
-0.001
-6.7%
1 jan 2012 ano
0.027
+0.015
121.96%
1 jan 2013 ano
0.022
-0.004
-15.63%
1 jan 2014 ano
0.021
-0.001
-6.13%
1 jan 2015 ano
0.026
+0.005
25.48%
Classificação de países por estatísticas atuais por anos


Comentários: