29
/pt/
pt
AIzaSyAYiBZKx7MnpbEhh9jyipgxe19OcubqV5w
April 1, 2024
278044
Uruguay
URY
true
2
1
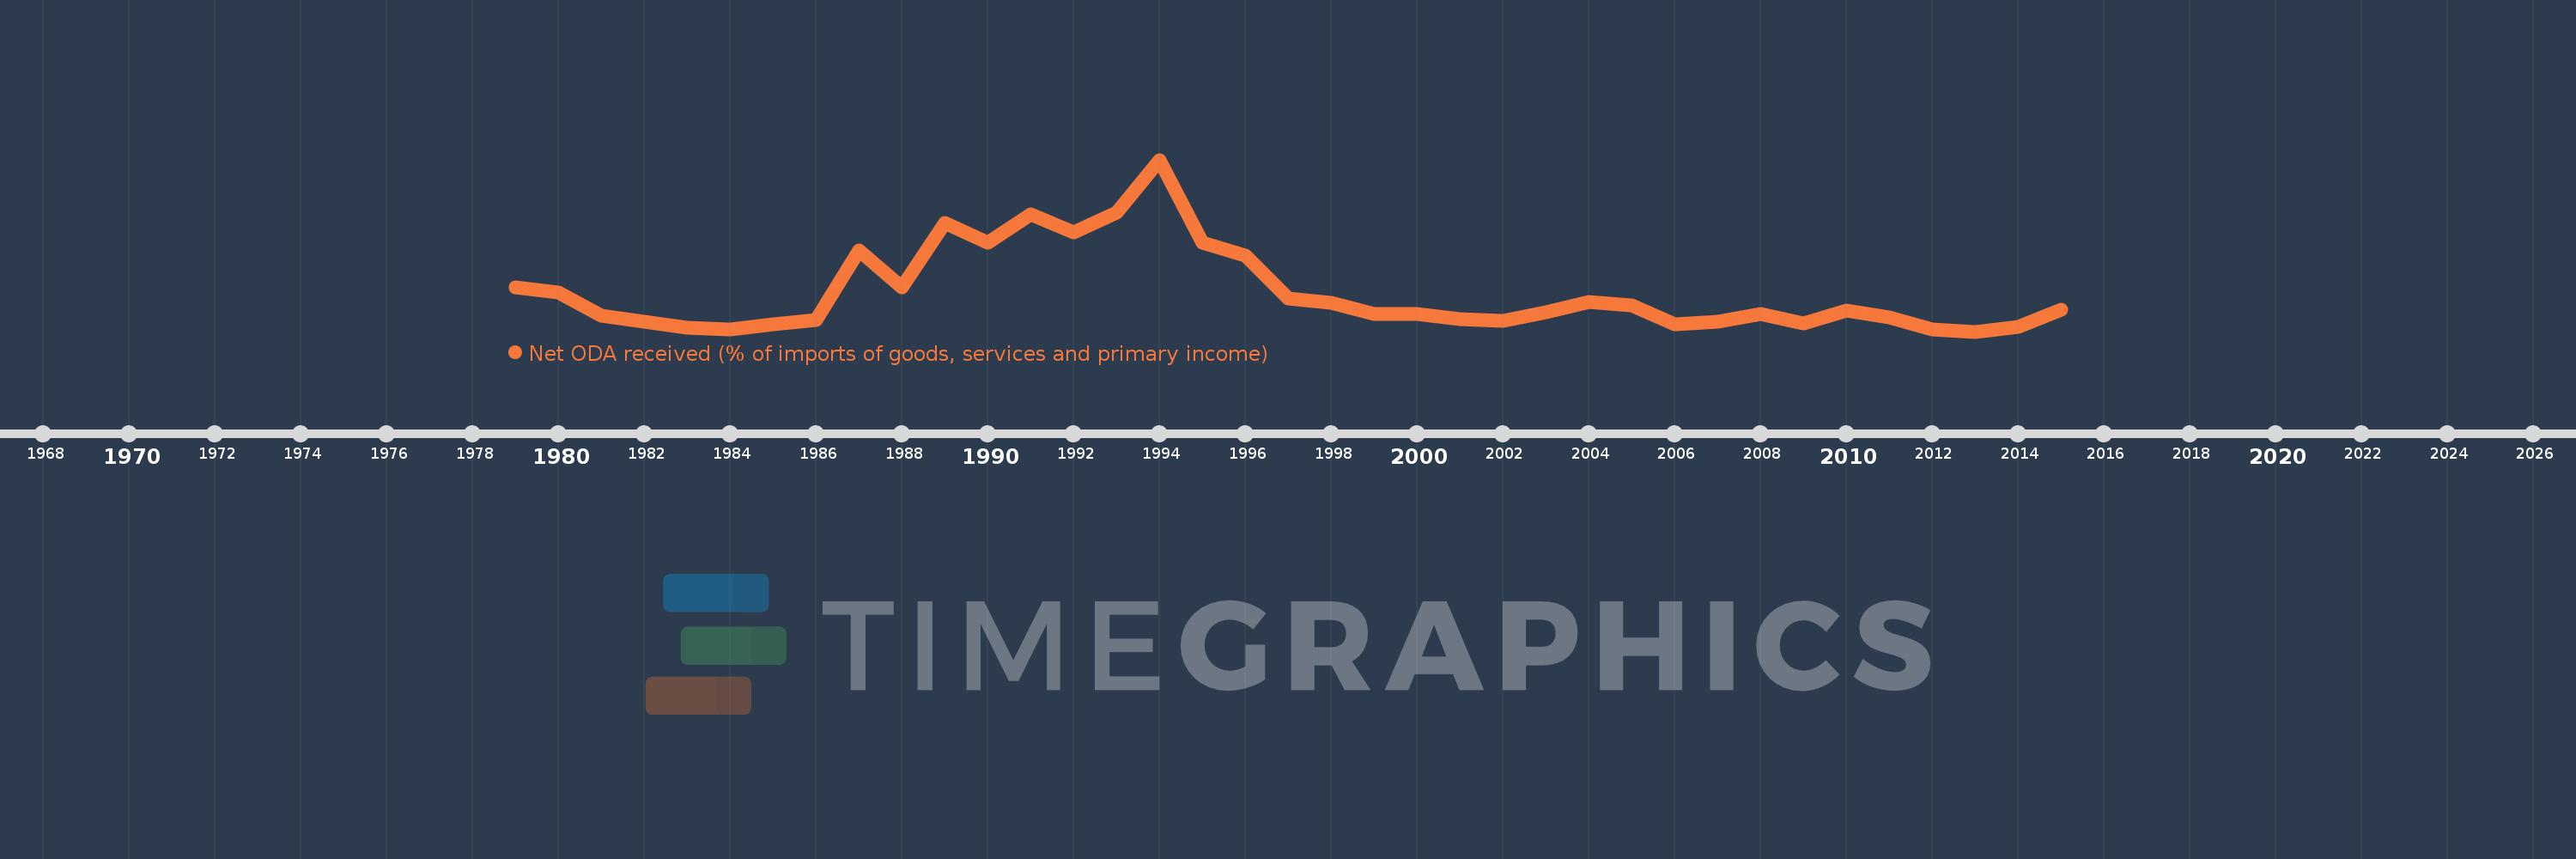
Net ODA received (% of imports of goods, services and primary income)
2015,2014,2013,2012,2011,2010,2009,2008,2007,2006,2005,2004,2003,2002,2001,2000,1999,1998,1997,1996,1995,1994,1993,1992,1991,1990,1989,1988,1987,1986,1985,1984,1983,1982,1981,1980,1979
Estas estatísticas em outros países:
AfghanistanAlbaniaAlgeriaAngolaAntigua and BarbudaArab WorldArgentinaArmeniaArubaAzerbaijanBahamas, TheBahrainBangladeshBarbadosBelarusBelizeBeninBhutanBoliviaBosnia and HerzegovinaBotswanaBrazilBurkina FasoBurundiCabo VerdeCambodiaCameroonCaribbean small statesCentral African RepublicCentral Europe and the BalticsChadChileChinaColombiaComorosCongo, Dem. Rep.Congo, Rep.Costa RicaCote d'IvoireCroatiaCyprusDjiboutiDominicaDominican RepublicEast Asia & PacificEast Asia & Pacific (excluding high income)East Asia & Pacific (IDA & IBRD countries)EcuadorEgypt, Arab Rep.El SalvadorEquatorial GuineaEritreaEthiopiaEuro areaEurope & Central AsiaEurope & Central Asia (excluding high income)Europe & Central Asia (IDA & IBRD countries)European UnionFijiFragile and conflict affected situationsGabonGambia, TheGeorgiaGhanaGrenadaGuatemalaGuineaGuinea-BissauGuyanaHaitiHeavily indebted poor countries (HIPC)High incomeHondurasIBRD onlyIDA & IBRD totalIDA blendIDA onlyIDA totalIndiaIndonesiaIran, Islamic Rep.IraqIsraelJamaicaJordanKazakhstanKenyaKiribatiKorea, Rep.KosovoKuwaitKyrgyz RepublicLao PDRLatin America & Caribbean Latin America & Caribbean (excluding high income)Latin America & the Caribbean (IDA & IBRD countries)Least developed countries: UN classificationLebanonLesothoLiberiaLibyaLow & middle incomeLow incomeLower middle incomeMacedonia, FYRMadagascarMalawiMalaysiaMaldivesMaliMaltaMarshall IslandsMauritaniaMauritiusMexicoMicronesia, Fed. Sts.Middle East & North Africa (excluding high income)Middle East & North Africa (IDA & IBRD countries)Middle incomeMoldovaMongoliaMontenegroMoroccoMozambiqueMyanmarNamibiaNepalNicaraguaNigerNigeriaNorth AmericaOECD membersOmanOther small statesPacific island small statesPakistanPalauPanamaPapua New GuineaParaguayPeruPhilippinesRwandaSamoaSao Tome and PrincipeSaudi ArabiaSenegalSerbiaSeychellesSierra LeoneSingaporeSloveniaSmall statesSolomon IslandsSouth AfricaSouth AsiaSouth Asia (IDA & IBRD)South SudanSri LankaSt. Kitts and NevisSt. LuciaSt. Vincent and the GrenadinesSub-Saharan Africa Sub-Saharan Africa (excluding high income)Sub-Saharan Africa (IDA & IBRD countries)SudanSurinameSwazilandSyrian Arab RepublicTajikistanTanzaniaThailandTimor-LesteTogoTongaTrinidad and TobagoTunisiaTurkeyTuvaluUgandaUkraineUpper middle incomeUruguayVanuatuVenezuela, RBVietnamWest Bank and GazaWorldYemen, Rep.ZambiaZimbabwe Linha do tempo:
Nesta escala de tempo está apresentado um gráfico de 1979 ano até 2015 ano Uruguay. Dados de 1978 ano ausente. O número de observações reais por data: 37.
Fonte (nome):
Indicadores de desenvolvimento mundial
Fonte (organização):
Development Assistance Committee of the Organisation for Economic Co-operation and Development, Geographical Distribution of Financial Flows to Developing Countries, Development Co-operation Report, and International Development Statistics database. Data are available online at: www.oecd.org/dac/stats/idsonline. World Bank imports of good and services estimates are used for the denominator.
Categorias:
Aid Effectiveness
Foi atualizado:
23 abr 2017 ano
Indicadores de alterações dos valores ao longo dos anos
Mínimo:
0.117
1 jan 2013 ano
Máximo:
3.385
1 jan 1994 ano
Na data de observação
Valor
Mudança absoluta
A alteração em relação ao valor anterior
1 jan 1979 ano
0.957
+0.957
0.0%
1 jan 1980 ano
0.866
-0.092
-9.58%
1 jan 1981 ano
0.416
-0.45
-51.92%
1 jan 1982 ano
0.305
-0.111
-26.6%
1 jan 1983 ano
0.185
-0.12
-39.43%
1 jan 1984 ano
0.16
-0.025
-13.63%
1 jan 1985 ano
0.251
+0.092
57.3%
1 jan 1986 ano
0.332
+0.081
32.03%
1 jan 1987 ano
1.666
+1.335
402.12%
1 jan 1988 ano
0.955
-0.712
-42.71%
1 jan 1989 ano
2.177
+1.222
128.0%
1 jan 1990 ano
1.816
-0.361
-16.56%
1 jan 1991 ano
2.342
+0.526
28.94%
1 jan 1992 ano
2.006
-0.335
-14.32%
1 jan 1993 ano
2.377
+0.37
18.45%
1 jan 1994 ano
3.385
+1.008
42.42%
1 jan 1995 ano
1.814
-1.57
-46.4%
1 jan 1996 ano
1.563
-0.251
-13.83%
1 jan 1997 ano
0.741
-0.823
-52.61%
1 jan 1998 ano
0.667
-0.074
-9.93%
1 jan 1999 ano
0.456
-0.211
-31.63%
1 jan 2000 ano
0.451
-0.005
-1.1%
1 jan 2001 ano
0.346
-0.106
-23.41%
1 jan 2002 ano
0.329
-0.017
-4.91%
1 jan 2003 ano
0.484
+0.155
47.19%
1 jan 2004 ano
0.681
+0.197
40.71%
1 jan 2005 ano
0.613
-0.068
-9.93%
1 jan 2006 ano
0.251
-0.362
-59.04%
1 jan 2007 ano
0.299
+0.048
19.06%
1 jan 2008 ano
0.453
+0.154
51.39%
1 jan 2009 ano
0.277
-0.175
-38.75%
1 jan 2010 ano
0.512
+0.235
84.84%
1 jan 2011 ano
0.388
-0.125
-24.36%
1 jan 2012 ano
0.15
-0.237
-61.23%
1 jan 2013 ano
0.117
-0.034
-22.48%
1 jan 2014 ano
0.212
+0.095
81.65%
1 jan 2015 ano
0.533
+0.321
151.75%
Classificação de países por estatísticas atuais por anos


Comentários: