29
/pt/
pt
AIzaSyAYiBZKx7MnpbEhh9jyipgxe19OcubqV5w
April 1, 2024
51797
North America
NAC
false
2
1
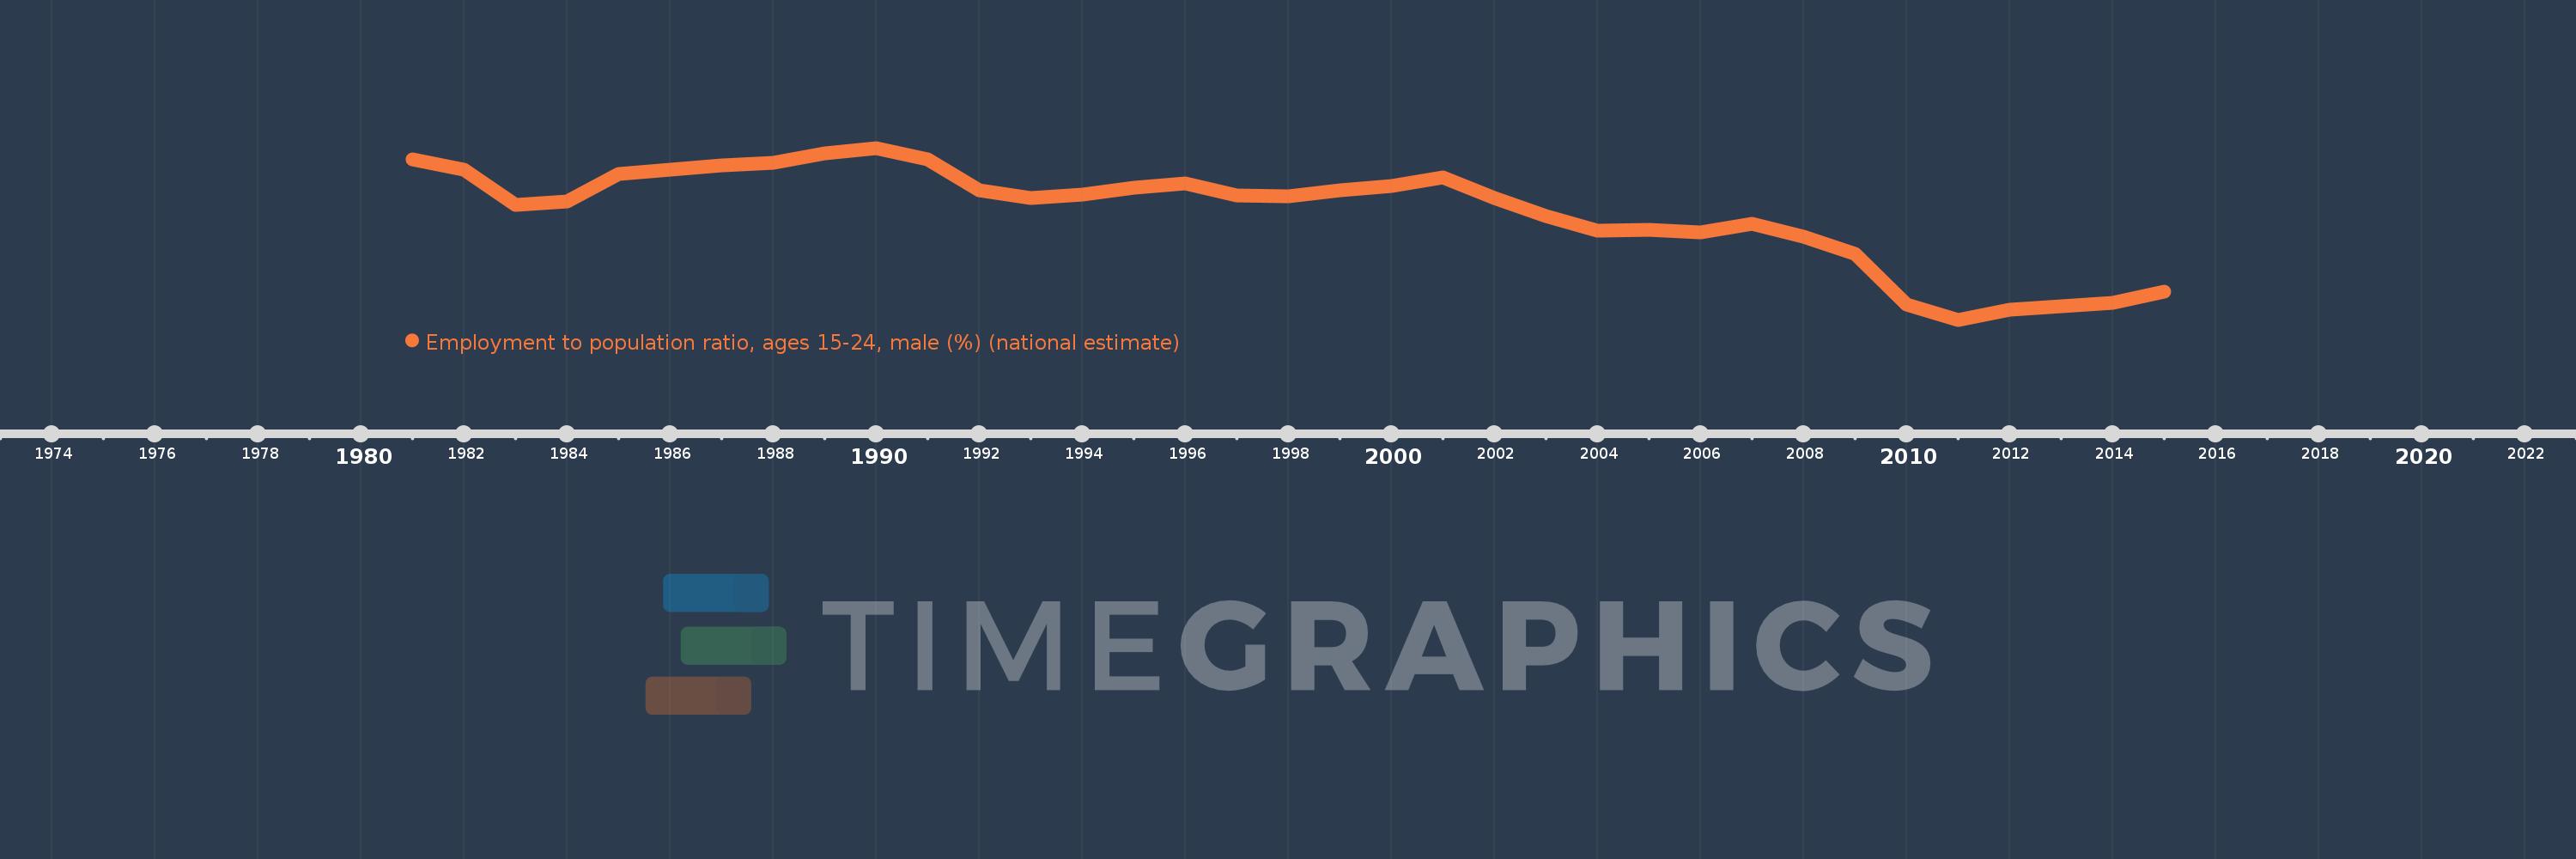
Employment to population ratio, ages 15-24, male (%) (national estimate)
2015,2014,2013,2012,2011,2010,2009,2008,2007,2006,2005,2004,2003,2002,2001,2000,1999,1998,1997,1996,1995,1994,1993,1992,1991,1990,1989,1988,1987,1986,1985,1984,1983,1982,1981
Estas estatísticas em outros países:
Linha do tempo:
Nesta escala de tempo está apresentado um gráfico de 1981 ano até 2015 ano North America. Dados de 1980 ano ausente. O número de observações reais por data: 35.
Fonte (nome):
Indicadores de desenvolvimento mundial
Fonte (organização):
International Labour Organization, Key Indicators of the Labour Market database.
Categorias:
Social Protection & Labor
Foi atualizado:
23 abr 2017 ano
Indicadores de alterações dos valores ao longo dos anos
Mínimo:
45.681
1 jan 2011 ano
Máximo:
64.71
1 jan 1990 ano
Na data de observação
Valor
Mudança absoluta
A alteração em relação ao valor anterior
1 jan 1981 ano
63.49
+63.49
0.0%
1 jan 1982 ano
62.333
-1.157
-1.82%
1 jan 1983 ano
58.435
-3.898
-6.25%
1 jan 1984 ano
58.803
+0.369
0.63%
1 jan 1985 ano
61.794
+2.99
5.08%
1 jan 1986 ano
62.287
+0.493
0.8%
1 jan 1987 ano
62.76
+0.473
0.76%
1 jan 1988 ano
63.04
+0.281
0.45%
1 jan 1989 ano
64.09
+1.05
1.67%
1 jan 1990 ano
64.71
+0.62
0.97%
1 jan 1991 ano
63.412
-1.298
-2.01%
1 jan 1992 ano
59.987
-3.425
-5.4%
1 jan 1993 ano
59.182
-0.805
-1.34%
1 jan 1994 ano
59.536
+0.354
0.6%
1 jan 1995 ano
60.328
+0.791
1.33%
1 jan 1996 ano
60.802
+0.474
0.79%
1 jan 1997 ano
59.433
-1.369
-2.25%
1 jan 1998 ano
59.387
-0.046
-0.08%
1 jan 1999 ano
60.042
+0.655
1.1%
1 jan 2000 ano
60.456
+0.413
0.69%
1 jan 2001 ano
61.405
+0.95
1.57%
1 jan 2002 ano
59.124
-2.281
-3.71%
1 jan 2003 ano
57.119
-2.005
-3.39%
1 jan 2004 ano
55.527
-1.592
-2.79%
1 jan 2005 ano
55.688
+0.161
0.29%
1 jan 2006 ano
55.34
-0.348
-0.62%
1 jan 2007 ano
56.341
+1.001
1.81%
1 jan 2008 ano
54.855
-1.486
-2.64%
1 jan 2009 ano
52.938
-1.917
-3.49%
1 jan 2010 ano
47.339
-5.599
-10.58%
1 jan 2011 ano
45.681
-1.659
-3.5%
1 jan 2012 ano
46.774
+1.094
2.39%
1 jan 2013 ano
47.221
+0.447
0.96%
1 jan 2014 ano
47.578
+0.357
0.75%
1 jan 2015 ano
48.766
+1.188
2.5%
Classificação de países por estatísticas atuais por anos


Comentários: