29
/pt/
pt
AIzaSyAYiBZKx7MnpbEhh9jyipgxe19OcubqV5w
April 1, 2024
139187
Germany
DEU
true
2
1
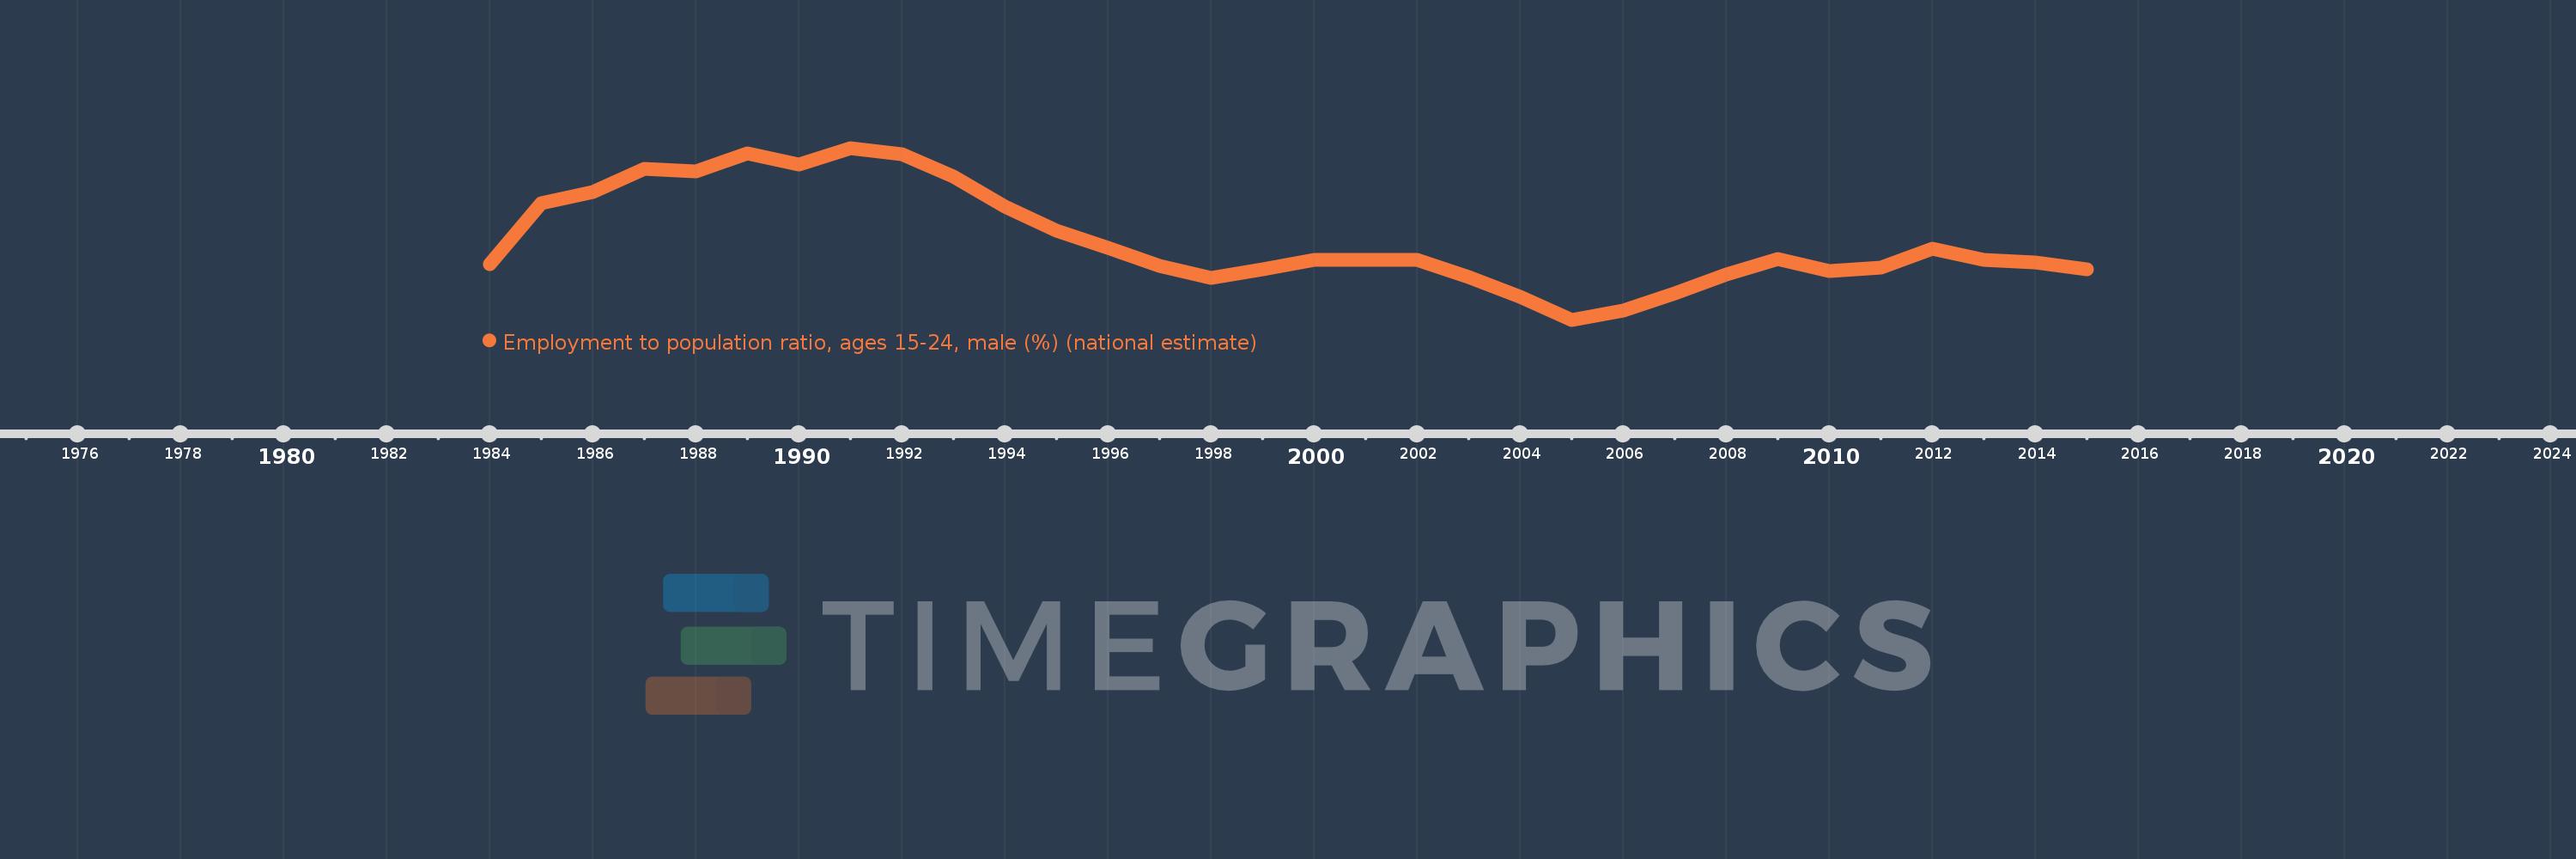
Employment to population ratio, ages 15-24, male (%) (national estimate)
2015,2014,2013,2012,2011,2010,2009,2008,2007,2006,2005,2004,2003,2002,2001,2000,1999,1998,1997,1996,1995,1994,1993,1992,1991,1990,1989,1988,1987,1986,1985,1984
Estas estatísticas em outros países:
Linha do tempo:
Nesta escala de tempo está apresentado um gráfico de 1984 ano até 2015 ano Germany. Dados de 1983 ano ausente. O número de observações reais por data: 32.
Fonte (nome):
Indicadores de desenvolvimento mundial
Fonte (organização):
International Labour Organization, Key Indicators of the Labour Market database.
Categorias:
Social Protection & Labor
Foi atualizado:
23 abr 2017 ano
Indicadores de alterações dos valores ao longo dos anos
Mínimo:
42.7
1 jan 2005 ano
Máximo:
59.7
1 jan 1991 ano
Na data de observação
Valor
Mudança absoluta
A alteração em relação ao valor anterior
1 jan 1984 ano
48.2
+48.2
0.0%
1 jan 1985 ano
54.2
+6.0
12.45%
1 jan 1986 ano
55.3
+1.1
2.03%
1 jan 1987 ano
57.6
+2.3
4.16%
1 jan 1988 ano
57.4
-0.2
-0.35%
1 jan 1989 ano
59.2
+1.8
3.14%
1 jan 1990 ano
58.1
-1.1
-1.86%
1 jan 1991 ano
59.7
+1.6
2.75%
1 jan 1992 ano
59.1
-0.6
-1.01%
1 jan 1993 ano
56.9
-2.2
-3.72%
1 jan 1994 ano
53.9
-3.0
-5.27%
1 jan 1995 ano
51.5
-2.4
-4.45%
1 jan 1996 ano
49.8
-1.7
-3.3%
1 jan 1997 ano
48.0
-1.8
-3.61%
1 jan 1998 ano
46.8
-1.2
-2.5%
1 jan 1999 ano
47.7
+0.9
1.92%
1 jan 2000 ano
48.6
+0.9
1.89%
1 jan 2001 ano
48.6
0.0
0.0%
1 jan 2002 ano
48.6
0.0
0.0%
1 jan 2003 ano
46.9
-1.7
-3.5%
1 jan 2004 ano
45.0
-1.9
-4.05%
1 jan 2005 ano
42.7
-2.3
-5.11%
1 jan 2006 ano
43.6
+0.9
2.11%
1 jan 2007 ano
45.3
+1.7
3.9%
1 jan 2008 ano
47.2
+1.9
4.19%
1 jan 2009 ano
48.7
+1.5
3.18%
1 jan 2010 ano
47.5
-1.2
-2.46%
1 jan 2011 ano
47.9
+0.4
0.84%
1 jan 2012 ano
49.7
+1.8
3.76%
1 jan 2013 ano
48.6
-1.1
-2.21%
1 jan 2014 ano
48.4
-0.2
-0.41%
1 jan 2015 ano
47.7
-0.7
-1.45%
Classificação de países por estatísticas atuais por anos


Comentários: