29
/pt/
pt
AIzaSyAYiBZKx7MnpbEhh9jyipgxe19OcubqV5w
April 1, 2024
50395
Middle East & North Africa (IDA & IBRD countries)
TMN
false
2
1
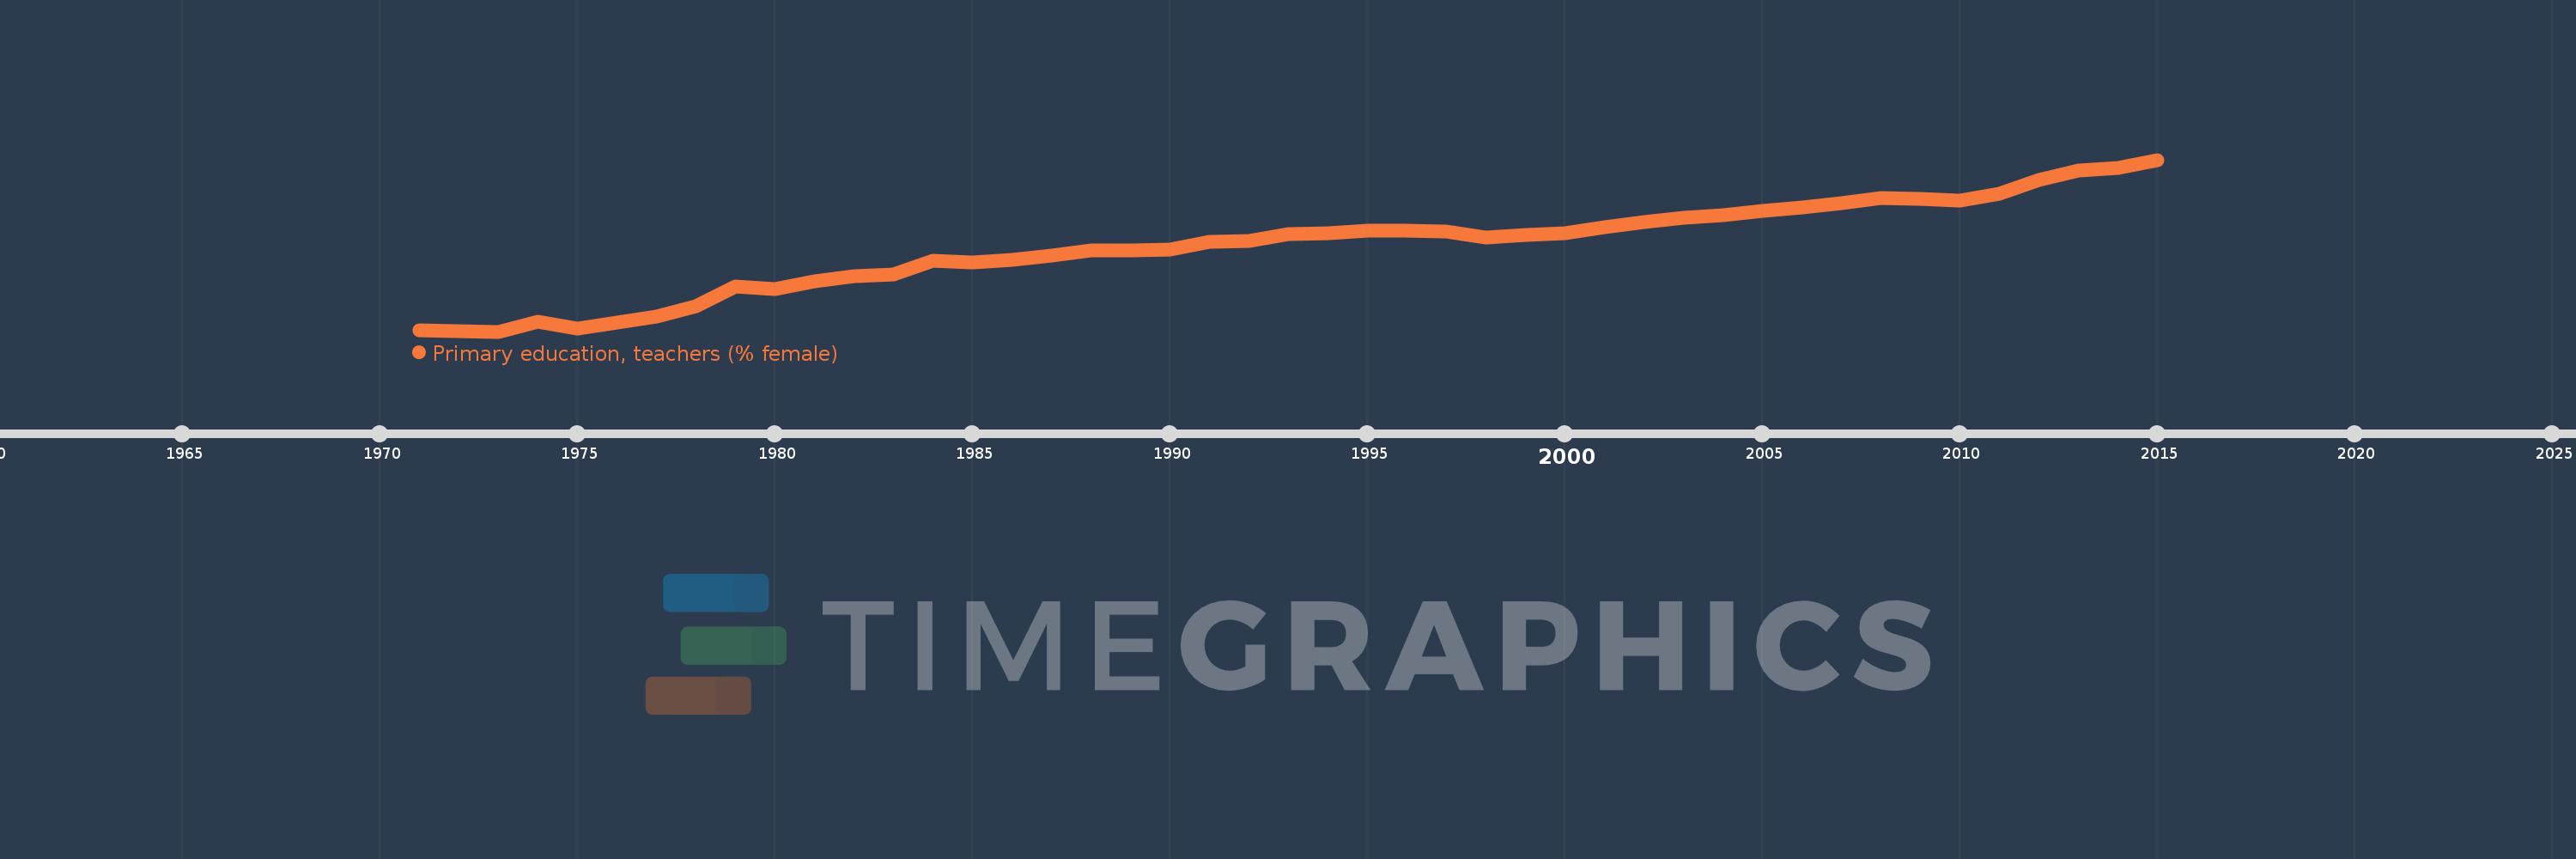
Primary education, teachers (% female)
2015,2014,2013,2012,2011,2010,2009,2008,2007,2006,2005,2004,2003,2002,2001,2000,1999,1998,1997,1996,1995,1994,1993,1992,1991,1990,1989,1988,1987,1986,1985,1984,1983,1982,1981,1980,1979,1978,1977,1976,1975,1974,1973,1972,1971
Estas estatísticas em outros países:
AfghanistanAlbaniaAlgeriaAndorraAngolaAntigua and BarbudaArab WorldArgentinaArmeniaArubaAustraliaAustriaAzerbaijanBahamas, TheBahrainBangladeshBarbadosBelarusBelgiumBelizeBeninBermudaBhutanBoliviaBosnia and HerzegovinaBotswanaBrazilBritish Virgin IslandsBrunei DarussalamBulgariaBurkina FasoBurundiCabo VerdeCambodiaCameroonCanadaCaribbean small statesCayman IslandsCentral African RepublicCentral Europe and the BalticsChadChileChinaColombiaComorosCongo, Dem. Rep.Congo, Rep.Costa RicaCote d'IvoireCroatiaCubaCyprusCzech RepublicDenmarkDjiboutiDominicaDominican RepublicEarly-demographic dividendEast Asia & PacificEast Asia & Pacific (excluding high income)East Asia & Pacific (IDA & IBRD countries)EcuadorEgypt, Arab Rep.El SalvadorEquatorial GuineaEritreaEstoniaEthiopiaEuro areaEurope & Central AsiaEurope & Central Asia (excluding high income)Europe & Central Asia (IDA & IBRD countries)European UnionFijiFinlandFragile and conflict affected situationsFranceGabonGambia, TheGeorgiaGermanyGhanaGibraltarGreeceGrenadaGuatemalaGuineaGuinea-BissauGuyanaHaitiHeavily indebted poor countries (HIPC)High incomeHondurasHong Kong SAR, ChinaHungaryIBRD onlyIcelandIDA & IBRD totalIDA blendIDA onlyIDA totalIndiaIndonesiaIran, Islamic Rep.IraqIrelandIsraelItalyJamaicaJapanJordanKazakhstanKenyaKiribatiKorea, Dem. People’s Rep.Korea, Rep.KuwaitKyrgyz RepublicLao PDRLate-demographic dividendLatin America & Caribbean Latin America & Caribbean (excluding high income)Latin America & the Caribbean (IDA & IBRD countries)LatviaLeast developed countries: UN classificationLebanonLesothoLiberiaLibyaLiechtensteinLithuaniaLow & middle incomeLow incomeLower middle incomeLuxembourgMacao SAR, ChinaMacedonia, FYRMadagascarMalawiMalaysiaMaldivesMaliMaltaMarshall IslandsMauritaniaMauritiusMexicoMiddle East & North AfricaMiddle East & North Africa (excluding high income)Middle East & North Africa (IDA & IBRD countries)Middle incomeMoldovaMonacoMongoliaMoroccoMozambiqueMyanmarNamibiaNauruNepalNetherlandsNew ZealandNicaraguaNigerNigeriaNorth AmericaNorwayOECD membersOmanOther small statesPacific island small statesPakistanPalauPanamaPapua New GuineaParaguayPeruPhilippinesPolandPortugalPost-demographic dividendPre-demographic dividendPuerto RicoQatarRomaniaRussian FederationRwandaSamoaSan MarinoSao Tome and PrincipeSaudi ArabiaSenegalSerbiaSeychellesSierra LeoneSingaporeSint Maarten (Dutch part)Slovak RepublicSloveniaSmall statesSolomon IslandsSomaliaSouth AfricaSouth AsiaSouth Asia (IDA & IBRD)South SudanSpainSri LankaSt. Kitts and NevisSt. LuciaSt. Vincent and the GrenadinesSub-Saharan Africa Sub-Saharan Africa (excluding high income)Sub-Saharan Africa (IDA & IBRD countries)SudanSurinameSwazilandSwedenSwitzerlandSyrian Arab RepublicTajikistanTanzaniaThailandTimor-LesteTogoTongaTrinidad and TobagoTunisiaTurkeyTurks and Caicos IslandsTuvaluUgandaUkraineUnited Arab EmiratesUnited KingdomUnited StatesUpper middle incomeUruguayUzbekistanVanuatuVenezuela, RBVietnamWest Bank and GazaWorldYemen, Rep.ZambiaZimbabwe Linha do tempo:
Nesta escala de tempo está apresentado um gráfico de 1971 ano até 2015 ano Middle East & North Africa (IDA & IBRD countries). Dados de 1970 ano ausente. O número de observações reais por data: 45.
Fonte (nome):
Indicadores de desenvolvimento mundial
Fonte (organização):
United Nations Educational, Scientific, and Cultural Organization (UNESCO) Institute for Statistics.
Categorias:
Education, Gender
Foi atualizado:
23 abr 2017 ano
Indicadores de alterações dos valores ao longo dos anos
Mínimo:
40.1
1 jan 1973 ano
Máximo:
60.845
1 jan 2015 ano
Na data de observação
Valor
Mudança absoluta
A alteração em relação ao valor anterior
1 jan 1971 ano
40.294
+40.294
0.0%
1 jan 1972 ano
40.171
-0.123
-0.31%
1 jan 1973 ano
40.1
-0.072
-0.18%
1 jan 1974 ano
41.338
+1.239
3.09%
1 jan 1975 ano
40.488
-0.85
-2.06%
1 jan 1976 ano
41.224
+0.736
1.82%
1 jan 1977 ano
41.903
+0.678
1.65%
1 jan 1978 ano
43.166
+1.263
3.01%
1 jan 1979 ano
45.551
+2.385
5.53%
1 jan 1980 ano
45.202
-0.349
-0.77%
1 jan 1981 ano
46.185
+0.983
2.17%
1 jan 1982 ano
46.748
+0.564
1.22%
1 jan 1983 ano
46.994
+0.246
0.53%
1 jan 1984 ano
48.615
+1.621
3.45%
1 jan 1985 ano
48.449
-0.166
-0.34%
1 jan 1986 ano
48.721
+0.272
0.56%
1 jan 1987 ano
49.299
+0.578
1.19%
1 jan 1988 ano
49.866
+0.567
1.15%
1 jan 1989 ano
49.917
+0.051
0.1%
1 jan 1990 ano
49.972
+0.055
0.11%
1 jan 1991 ano
50.904
+0.933
1.87%
1 jan 1992 ano
51.069
+0.165
0.32%
1 jan 1993 ano
51.832
+0.763
1.49%
1 jan 1994 ano
51.994
+0.163
0.31%
1 jan 1995 ano
52.328
+0.334
0.64%
1 jan 1996 ano
52.26
-0.068
-0.13%
1 jan 1997 ano
52.143
-0.117
-0.22%
1 jan 1998 ano
51.48
-0.662
-1.27%
1 jan 1999 ano
51.778
+0.298
0.58%
1 jan 2000 ano
51.974
+0.196
0.38%
1 jan 2001 ano
52.675
+0.7
1.35%
1 jan 2002 ano
53.332
+0.657
1.25%
1 jan 2003 ano
53.839
+0.508
0.95%
1 jan 2004 ano
54.139
+0.3
0.56%
1 jan 2005 ano
54.713
+0.574
1.06%
1 jan 2006 ano
55.122
+0.409
0.75%
1 jan 2007 ano
55.645
+0.523
0.95%
1 jan 2008 ano
56.247
+0.602
1.08%
1 jan 2009 ano
56.168
-0.079
-0.14%
1 jan 2010 ano
55.939
-0.229
-0.41%
1 jan 2011 ano
56.722
+0.783
1.4%
1 jan 2012 ano
58.389
+1.667
2.94%
1 jan 2013 ano
59.515
+1.126
1.93%
1 jan 2014 ano
59.839
+0.324
0.54%
1 jan 2015 ano
60.845
+1.006
1.68%
Classificação de países por estatísticas atuais por anos


Comentários: