29
/pt/
pt
AIzaSyAYiBZKx7MnpbEhh9jyipgxe19OcubqV5w
April 1, 2024
31068
Europe & Central Asia
ECS
false
2
1
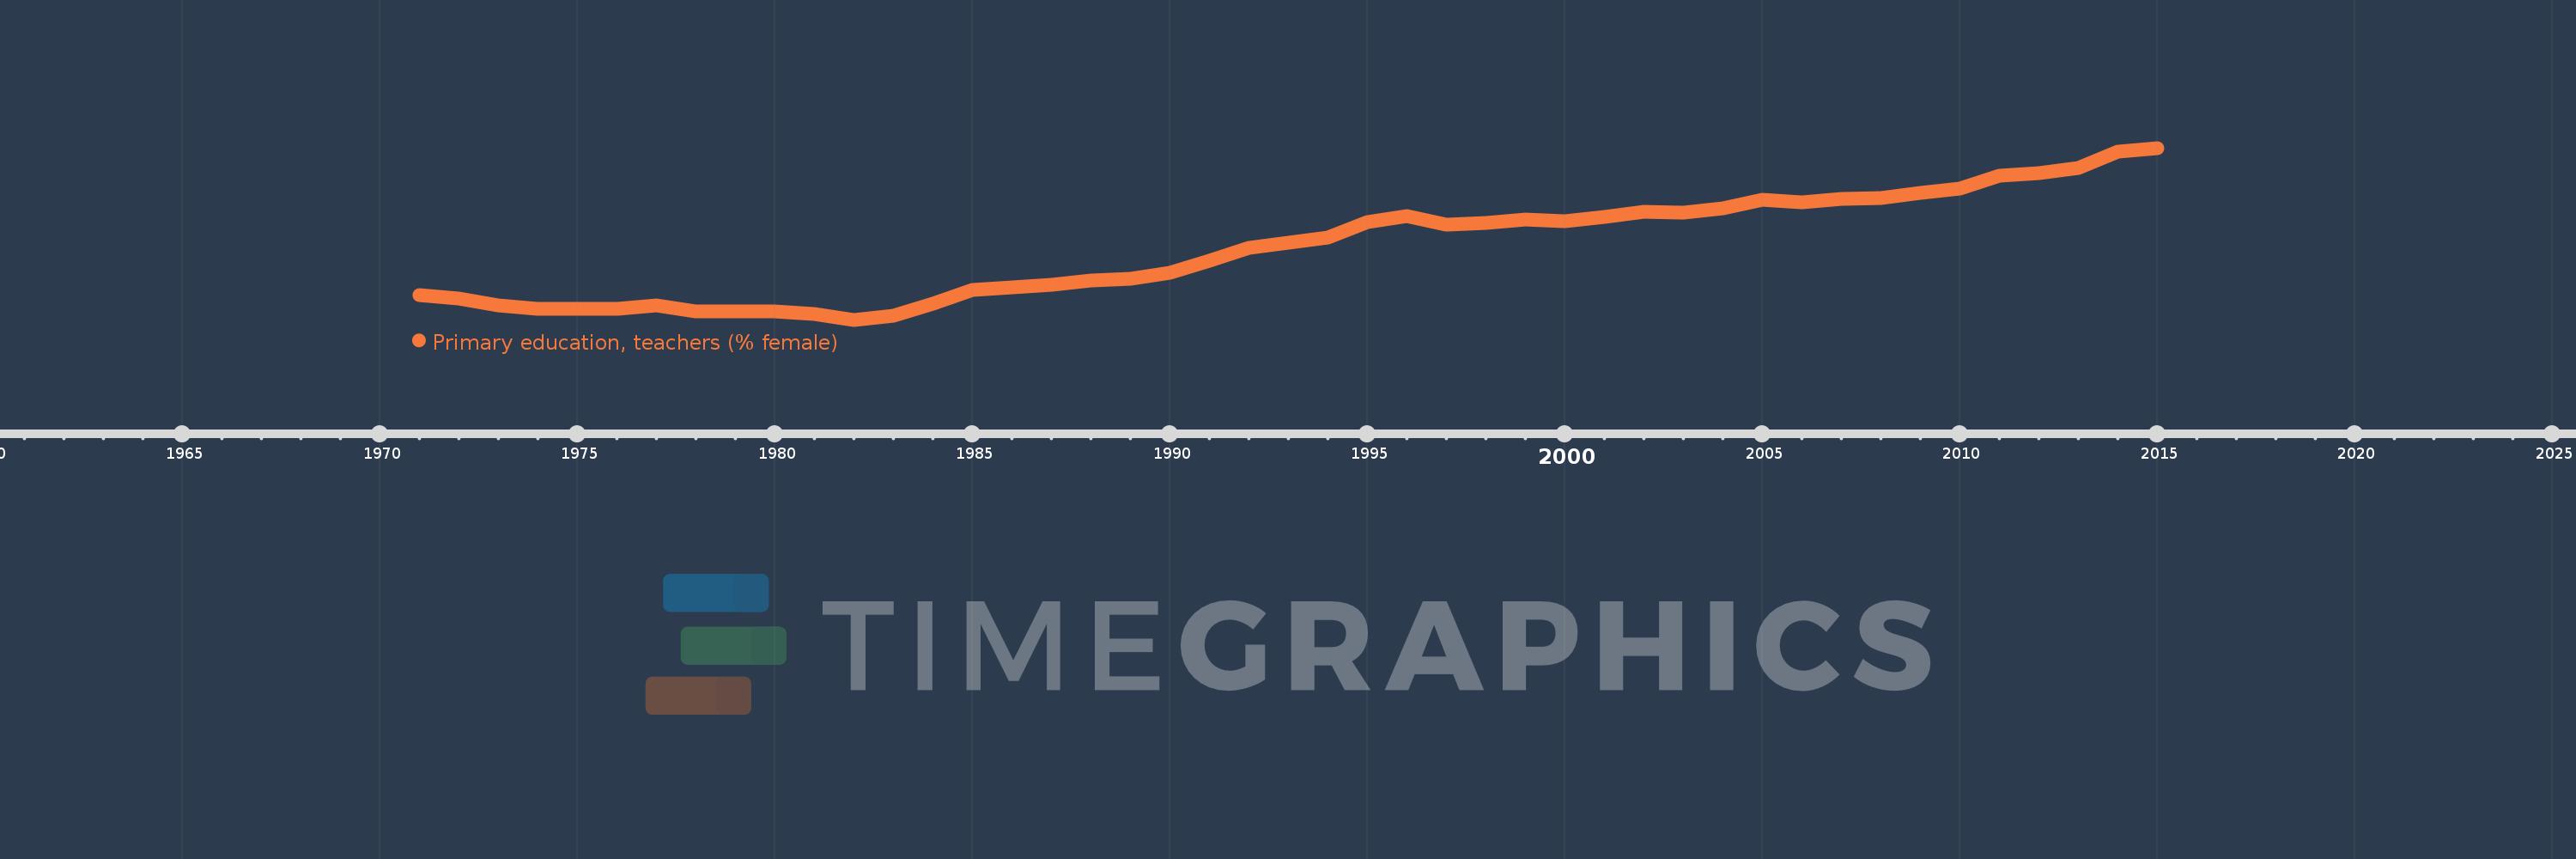
Primary education, teachers (% female)
2015,2014,2013,2012,2011,2010,2009,2008,2007,2006,2005,2004,2003,2002,2001,2000,1999,1998,1997,1996,1995,1994,1993,1992,1991,1990,1989,1988,1987,1986,1985,1984,1983,1982,1981,1980,1979,1978,1977,1976,1975,1974,1973,1972,1971
Estas estatísticas em outros países:
AfghanistanAlbaniaAlgeriaAndorraAngolaAntigua and BarbudaArab WorldArgentinaArmeniaArubaAustraliaAustriaAzerbaijanBahamas, TheBahrainBangladeshBarbadosBelarusBelgiumBelizeBeninBermudaBhutanBoliviaBosnia and HerzegovinaBotswanaBrazilBritish Virgin IslandsBrunei DarussalamBulgariaBurkina FasoBurundiCabo VerdeCambodiaCameroonCanadaCaribbean small statesCayman IslandsCentral African RepublicCentral Europe and the BalticsChadChileChinaColombiaComorosCongo, Dem. Rep.Congo, Rep.Costa RicaCote d'IvoireCroatiaCubaCyprusCzech RepublicDenmarkDjiboutiDominicaDominican RepublicEarly-demographic dividendEast Asia & PacificEast Asia & Pacific (excluding high income)East Asia & Pacific (IDA & IBRD countries)EcuadorEgypt, Arab Rep.El SalvadorEquatorial GuineaEritreaEstoniaEthiopiaEuro areaEurope & Central AsiaEurope & Central Asia (excluding high income)Europe & Central Asia (IDA & IBRD countries)European UnionFijiFinlandFragile and conflict affected situationsFranceGabonGambia, TheGeorgiaGermanyGhanaGibraltarGreeceGrenadaGuatemalaGuineaGuinea-BissauGuyanaHaitiHeavily indebted poor countries (HIPC)High incomeHondurasHong Kong SAR, ChinaHungaryIBRD onlyIcelandIDA & IBRD totalIDA blendIDA onlyIDA totalIndiaIndonesiaIran, Islamic Rep.IraqIrelandIsraelItalyJamaicaJapanJordanKazakhstanKenyaKiribatiKorea, Dem. People’s Rep.Korea, Rep.KuwaitKyrgyz RepublicLao PDRLate-demographic dividendLatin America & Caribbean Latin America & Caribbean (excluding high income)Latin America & the Caribbean (IDA & IBRD countries)LatviaLeast developed countries: UN classificationLebanonLesothoLiberiaLibyaLiechtensteinLithuaniaLow & middle incomeLow incomeLower middle incomeLuxembourgMacao SAR, ChinaMacedonia, FYRMadagascarMalawiMalaysiaMaldivesMaliMaltaMarshall IslandsMauritaniaMauritiusMexicoMiddle East & North AfricaMiddle East & North Africa (excluding high income)Middle East & North Africa (IDA & IBRD countries)Middle incomeMoldovaMonacoMongoliaMoroccoMozambiqueMyanmarNamibiaNauruNepalNetherlandsNew ZealandNicaraguaNigerNigeriaNorth AmericaNorwayOECD membersOmanOther small statesPacific island small statesPakistanPalauPanamaPapua New GuineaParaguayPeruPhilippinesPolandPortugalPost-demographic dividendPre-demographic dividendPuerto RicoQatarRomaniaRussian FederationRwandaSamoaSan MarinoSao Tome and PrincipeSaudi ArabiaSenegalSerbiaSeychellesSierra LeoneSingaporeSint Maarten (Dutch part)Slovak RepublicSloveniaSmall statesSolomon IslandsSomaliaSouth AfricaSouth AsiaSouth Asia (IDA & IBRD)South SudanSpainSri LankaSt. Kitts and NevisSt. LuciaSt. Vincent and the GrenadinesSub-Saharan Africa Sub-Saharan Africa (excluding high income)Sub-Saharan Africa (IDA & IBRD countries)SudanSurinameSwazilandSwedenSwitzerlandSyrian Arab RepublicTajikistanTanzaniaThailandTimor-LesteTogoTongaTrinidad and TobagoTunisiaTurkeyTurks and Caicos IslandsTuvaluUgandaUkraineUnited Arab EmiratesUnited KingdomUnited StatesUpper middle incomeUruguayUzbekistanVanuatuVenezuela, RBVietnamWest Bank and GazaWorldYemen, Rep.ZambiaZimbabwe Linha do tempo:
Nesta escala de tempo está apresentado um gráfico de 1971 ano até 2015 ano Europe & Central Asia. Dados de 1970 ano ausente. O número de observações reais por data: 45.
Fonte (nome):
Indicadores de desenvolvimento mundial
Fonte (organização):
United Nations Educational, Scientific, and Cultural Organization (UNESCO) Institute for Statistics.
Categorias:
Education, Gender
Foi atualizado:
23 abr 2017 ano
Indicadores de alterações dos valores ao longo dos anos
Mínimo:
76.878
1 jan 1982 ano
Máximo:
84.741
1 jan 2015 ano
Na data de observação
Valor
Mudança absoluta
A alteração em relação ao valor anterior
1 jan 1971 ano
77.993
+77.993
0.0%
1 jan 1972 ano
77.835
-0.158
-0.2%
1 jan 1973 ano
77.542
-0.293
-0.38%
1 jan 1974 ano
77.373
-0.169
-0.22%
1 jan 1975 ano
77.389
+0.016
0.02%
1 jan 1976 ano
77.38
-0.009
-0.01%
1 jan 1977 ano
77.544
+0.164
0.21%
1 jan 1978 ano
77.269
-0.275
-0.36%
1 jan 1979 ano
77.266
-0.003
0.0%
1 jan 1980 ano
77.248
-0.018
-0.02%
1 jan 1981 ano
77.141
-0.106
-0.14%
1 jan 1982 ano
76.878
-0.263
-0.34%
1 jan 1983 ano
77.066
+0.188
0.24%
1 jan 1984 ano
77.594
+0.528
0.68%
1 jan 1985 ano
78.242
+0.648
0.84%
1 jan 1986 ano
78.344
+0.103
0.13%
1 jan 1987 ano
78.459
+0.115
0.15%
1 jan 1988 ano
78.671
+0.212
0.27%
1 jan 1989 ano
78.749
+0.078
0.1%
1 jan 1990 ano
79.048
+0.299
0.38%
1 jan 1991 ano
79.594
+0.545
0.69%
1 jan 1992 ano
80.152
+0.558
0.7%
1 jan 1993 ano
80.417
+0.265
0.33%
1 jan 1994 ano
80.637
+0.221
0.27%
1 jan 1995 ano
81.35
+0.712
0.88%
1 jan 1996 ano
81.617
+0.267
0.33%
1 jan 1997 ano
81.236
-0.381
-0.47%
1 jan 1998 ano
81.315
+0.078
0.1%
1 jan 1999 ano
81.448
+0.133
0.16%
1 jan 2000 ano
81.406
-0.042
-0.05%
1 jan 2001 ano
81.59
+0.184
0.23%
1 jan 2002 ano
81.813
+0.223
0.27%
1 jan 2003 ano
81.768
-0.045
-0.06%
1 jan 2004 ano
81.987
+0.219
0.27%
1 jan 2005 ano
82.374
+0.386
0.47%
1 jan 2006 ano
82.238
-0.136
-0.16%
1 jan 2007 ano
82.41
+0.172
0.21%
1 jan 2008 ano
82.43
+0.02
0.02%
1 jan 2009 ano
82.699
+0.269
0.33%
1 jan 2010 ano
82.867
+0.168
0.2%
1 jan 2011 ano
83.488
+0.622
0.75%
1 jan 2012 ano
83.572
+0.083
0.1%
1 jan 2013 ano
83.825
+0.253
0.3%
1 jan 2014 ano
84.576
+0.752
0.9%
1 jan 2015 ano
84.741
+0.165
0.2%
Classificação de países por estatísticas atuais por anos


Comentários: