29
/pt/
pt
AIzaSyAYiBZKx7MnpbEhh9jyipgxe19OcubqV5w
April 1, 2024
48535
Middle East & North Africa
MEA
false
2
1
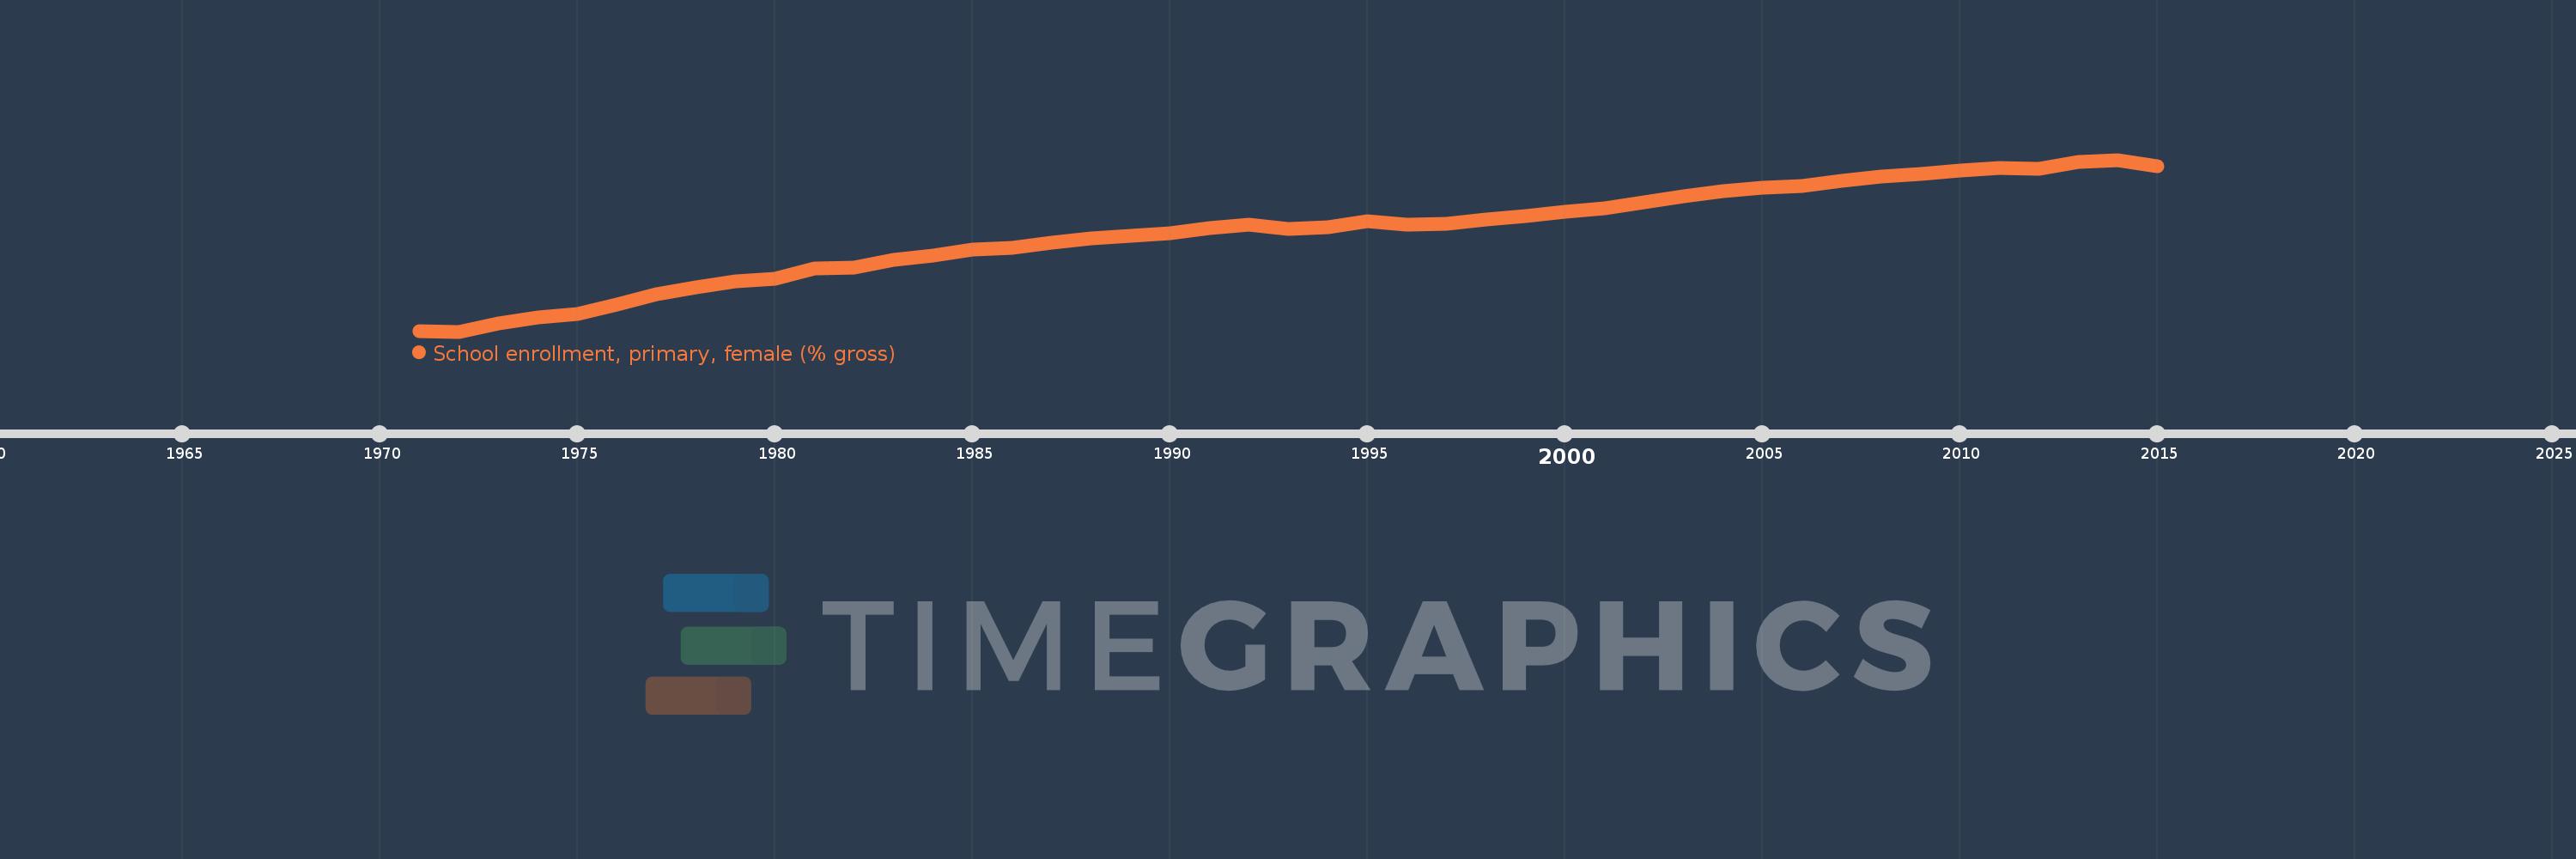
School enrollment, primary, female (% gross)
2015,2014,2013,2012,2011,2010,2009,2008,2007,2006,2005,2004,2003,2002,2001,2000,1999,1998,1997,1996,1995,1994,1993,1992,1991,1990,1989,1988,1987,1986,1985,1984,1983,1982,1981,1980,1979,1978,1977,1976,1975,1974,1973,1972,1971
Estas estatísticas em outros países:
AfghanistanAlbaniaAlgeriaAndorraAngolaAntigua and BarbudaArab WorldArgentinaArmeniaArubaAustraliaAustriaAzerbaijanBahamas, TheBahrainBangladeshBarbadosBelarusBelgiumBelizeBeninBermudaBhutanBoliviaBosnia and HerzegovinaBotswanaBrazilBrunei DarussalamBulgariaBurkina FasoBurundiCabo VerdeCambodiaCameroonCanadaCaribbean small statesCentral African RepublicCentral Europe and the BalticsChadChileChinaColombiaComorosCongo, Dem. Rep.Congo, Rep.Costa RicaCote d'IvoireCroatiaCubaCuracaoCyprusCzech RepublicDenmarkDjiboutiDominicaDominican RepublicEarly-demographic dividendEast Asia & PacificEast Asia & Pacific (excluding high income)East Asia & Pacific (IDA & IBRD countries)EcuadorEgypt, Arab Rep.El SalvadorEquatorial GuineaEritreaEstoniaEthiopiaEuro areaEurope & Central AsiaEurope & Central Asia (excluding high income)Europe & Central Asia (IDA & IBRD countries)European UnionFijiFinlandFragile and conflict affected situationsFranceGabonGambia, TheGeorgiaGermanyGhanaGreeceGrenadaGuatemalaGuineaGuinea-BissauGuyanaHaitiHeavily indebted poor countries (HIPC)High incomeHondurasHong Kong SAR, ChinaHungaryIBRD onlyIcelandIDA & IBRD totalIDA blendIDA onlyIDA totalIndiaIndonesiaIran, Islamic Rep.IraqIrelandIsraelItalyJamaicaJapanJordanKazakhstanKenyaKiribatiKorea, Dem. People’s Rep.Korea, Rep.KuwaitKyrgyz RepublicLao PDRLate-demographic dividendLatin America & Caribbean Latin America & Caribbean (excluding high income)Latin America & the Caribbean (IDA & IBRD countries)LatviaLeast developed countries: UN classificationLebanonLesothoLiberiaLibyaLiechtensteinLithuaniaLow & middle incomeLow incomeLower middle incomeLuxembourgMacao SAR, ChinaMacedonia, FYRMadagascarMalawiMaldivesMaliMaltaMarshall IslandsMauritaniaMauritiusMexicoMicronesia, Fed. Sts.Middle East & North AfricaMiddle East & North Africa (excluding high income)Middle East & North Africa (IDA & IBRD countries)Middle incomeMoldovaMongoliaMontenegroMoroccoMozambiqueMyanmarNamibiaNauruNepalNetherlandsNew ZealandNicaraguaNigerNigeriaNorth AmericaNorwayOECD membersOmanOther small statesPacific island small statesPakistanPalauPanamaPapua New GuineaParaguayPeruPhilippinesPolandPortugalPost-demographic dividendPre-demographic dividendPuerto RicoQatarRomaniaRussian FederationRwandaSamoaSan MarinoSao Tome and PrincipeSaudi ArabiaSenegalSerbiaSeychellesSierra LeoneSlovak RepublicSloveniaSmall statesSolomon IslandsSomaliaSouth AfricaSouth AsiaSouth Asia (IDA & IBRD)South SudanSpainSri LankaSt. Kitts and NevisSt. LuciaSt. Vincent and the GrenadinesSub-Saharan Africa Sub-Saharan Africa (excluding high income)Sub-Saharan Africa (IDA & IBRD countries)SudanSurinameSwazilandSwedenSwitzerlandSyrian Arab RepublicTajikistanTanzaniaThailandTimor-LesteTogoTongaTrinidad and TobagoTunisiaTurkeyTurkmenistanTuvaluUgandaUkraineUnited Arab EmiratesUnited KingdomUnited StatesUpper middle incomeUruguayUzbekistanVanuatuVenezuela, RBVietnamWest Bank and GazaWorldYemen, Rep.ZambiaZimbabwe Linha do tempo:
Nesta escala de tempo está apresentado um gráfico de 1971 ano até 2015 ano Middle East & North Africa. Dados de 1970 ano ausente. O número de observações reais por data: 45.
Fonte (nome):
Indicadores de desenvolvimento mundial
Fonte (organização):
United Nations Educational, Scientific, and Cultural Organization (UNESCO) Institute for Statistics.
Categorias:
Education, Gender
Foi atualizado:
23 abr 2017 ano
Indicadores de alterações dos valores ao longo dos anos
Mínimo:
54.594
1 jan 1972 ano
Máximo:
104.921
1 jan 2014 ano
Na data de observação
Valor
Mudança absoluta
A alteração em relação ao valor anterior
1 jan 1971 ano
54.642
+54.642
0.0%
1 jan 1972 ano
54.594
-0.047
-0.09%
1 jan 1973 ano
57.073
+2.478
4.54%
1 jan 1974 ano
58.845
+1.772
3.11%
1 jan 1975 ano
59.75
+0.905
1.54%
1 jan 1976 ano
62.637
+2.887
4.83%
1 jan 1977 ano
65.519
+2.882
4.6%
1 jan 1978 ano
67.658
+2.139
3.26%
1 jan 1979 ano
69.241
+1.583
2.34%
1 jan 1980 ano
70.014
+0.773
1.12%
1 jan 1981 ano
73.121
+3.107
4.44%
1 jan 1982 ano
73.439
+0.318
0.44%
1 jan 1983 ano
75.539
+2.1
2.86%
1 jan 1984 ano
76.932
+1.393
1.84%
1 jan 1985 ano
78.623
+1.69
2.2%
1 jan 1986 ano
79.162
+0.539
0.69%
1 jan 1987 ano
80.585
+1.423
1.8%
1 jan 1988 ano
81.899
+1.315
1.63%
1 jan 1989 ano
82.664
+0.765
0.93%
1 jan 1990 ano
83.31
+0.646
0.78%
1 jan 1991 ano
84.989
+1.679
2.01%
1 jan 1992 ano
85.9
+0.912
1.07%
1 jan 1993 ano
84.573
-1.328
-1.55%
1 jan 1994 ano
85.134
+0.561
0.66%
1 jan 1995 ano
86.805
+1.671
1.96%
1 jan 1996 ano
85.832
-0.973
-1.12%
1 jan 1997 ano
86.091
+0.259
0.3%
1 jan 1998 ano
87.494
+1.403
1.63%
1 jan 1999 ano
88.49
+0.996
1.14%
1 jan 2000 ano
89.628
+1.138
1.29%
1 jan 2001 ano
90.821
+1.193
1.33%
1 jan 2002 ano
92.509
+1.688
1.86%
1 jan 2003 ano
94.224
+1.715
1.85%
1 jan 2004 ano
95.785
+1.561
1.66%
1 jan 2005 ano
96.808
+1.023
1.07%
1 jan 2006 ano
97.361
+0.553
0.57%
1 jan 2007 ano
98.688
+1.327
1.36%
1 jan 2008 ano
100.044
+1.356
1.37%
1 jan 2009 ano
100.811
+0.767
0.77%
1 jan 2010 ano
101.803
+0.991
0.98%
1 jan 2011 ano
102.627
+0.825
0.81%
1 jan 2012 ano
102.154
-0.473
-0.46%
1 jan 2013 ano
104.195
+2.041
2.0%
1 jan 2014 ano
104.921
+0.726
0.7%
1 jan 2015 ano
103.047
-1.874
-1.79%
Classificação de países por estatísticas atuais por anos


Comentários: