29
/pt/
pt
AIzaSyAYiBZKx7MnpbEhh9jyipgxe19OcubqV5w
April 1, 2024
27691
East Asia & Pacific
EAS
false
2
1
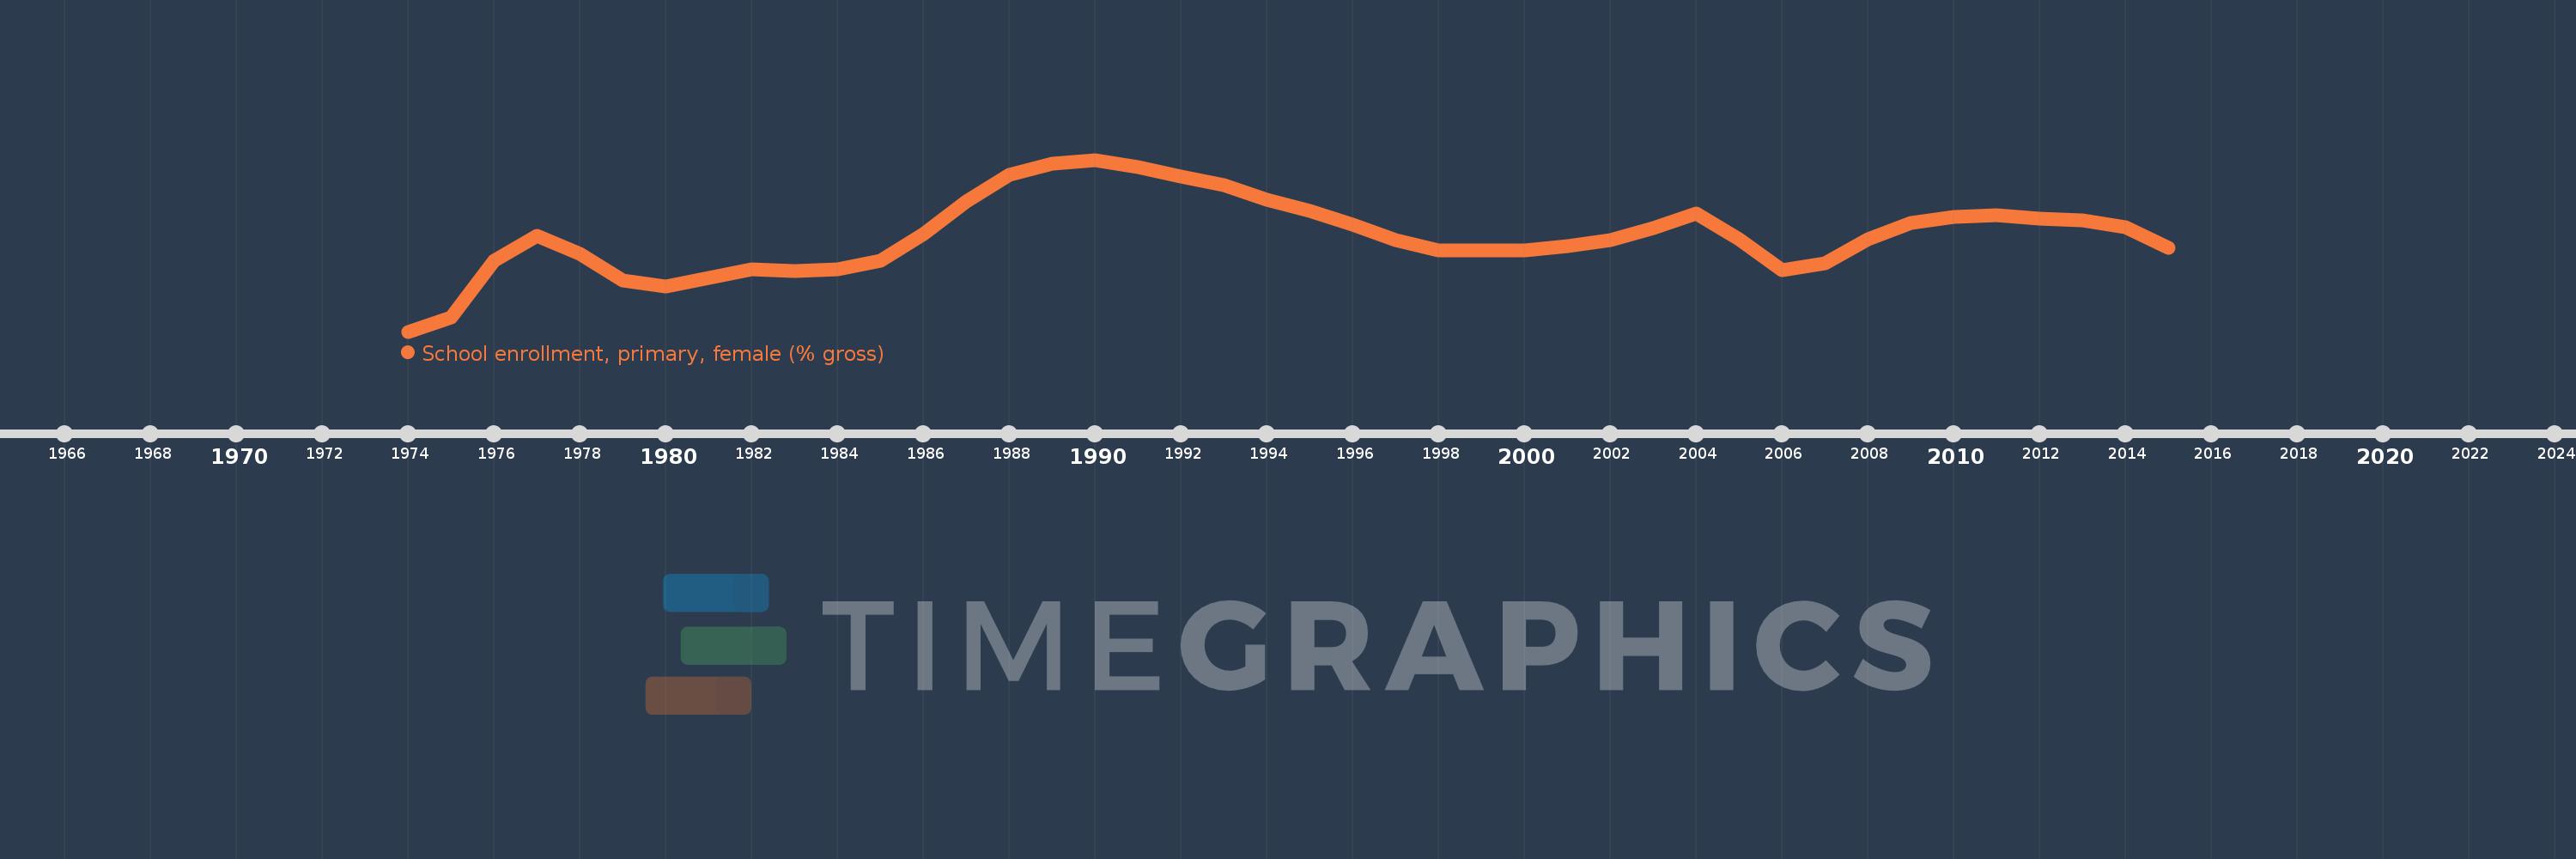
School enrollment, primary, female (% gross)
2015,2014,2013,2012,2011,2010,2009,2008,2007,2006,2005,2004,2003,2002,2001,2000,1999,1998,1997,1996,1995,1994,1993,1992,1991,1990,1989,1988,1987,1986,1985,1984,1983,1982,1981,1980,1979,1978,1977,1976,1975,1974
Estas estatísticas em outros países:
AfghanistanAlbaniaAlgeriaAndorraAngolaAntigua and BarbudaArab WorldArgentinaArmeniaArubaAustraliaAustriaAzerbaijanBahamas, TheBahrainBangladeshBarbadosBelarusBelgiumBelizeBeninBermudaBhutanBoliviaBosnia and HerzegovinaBotswanaBrazilBrunei DarussalamBulgariaBurkina FasoBurundiCabo VerdeCambodiaCameroonCanadaCaribbean small statesCentral African RepublicCentral Europe and the BalticsChadChileChinaColombiaComorosCongo, Dem. Rep.Congo, Rep.Costa RicaCote d'IvoireCroatiaCubaCuracaoCyprusCzech RepublicDenmarkDjiboutiDominicaDominican RepublicEarly-demographic dividendEast Asia & PacificEast Asia & Pacific (excluding high income)East Asia & Pacific (IDA & IBRD countries)EcuadorEgypt, Arab Rep.El SalvadorEquatorial GuineaEritreaEstoniaEthiopiaEuro areaEurope & Central AsiaEurope & Central Asia (excluding high income)Europe & Central Asia (IDA & IBRD countries)European UnionFijiFinlandFragile and conflict affected situationsFranceGabonGambia, TheGeorgiaGermanyGhanaGreeceGrenadaGuatemalaGuineaGuinea-BissauGuyanaHaitiHeavily indebted poor countries (HIPC)High incomeHondurasHong Kong SAR, ChinaHungaryIBRD onlyIcelandIDA & IBRD totalIDA blendIDA onlyIDA totalIndiaIndonesiaIran, Islamic Rep.IraqIrelandIsraelItalyJamaicaJapanJordanKazakhstanKenyaKiribatiKorea, Dem. People’s Rep.Korea, Rep.KuwaitKyrgyz RepublicLao PDRLate-demographic dividendLatin America & Caribbean Latin America & Caribbean (excluding high income)Latin America & the Caribbean (IDA & IBRD countries)LatviaLeast developed countries: UN classificationLebanonLesothoLiberiaLibyaLiechtensteinLithuaniaLow & middle incomeLow incomeLower middle incomeLuxembourgMacao SAR, ChinaMacedonia, FYRMadagascarMalawiMaldivesMaliMaltaMarshall IslandsMauritaniaMauritiusMexicoMicronesia, Fed. Sts.Middle East & North AfricaMiddle East & North Africa (excluding high income)Middle East & North Africa (IDA & IBRD countries)Middle incomeMoldovaMongoliaMontenegroMoroccoMozambiqueMyanmarNamibiaNauruNepalNetherlandsNew ZealandNicaraguaNigerNigeriaNorth AmericaNorwayOECD membersOmanOther small statesPacific island small statesPakistanPalauPanamaPapua New GuineaParaguayPeruPhilippinesPolandPortugalPost-demographic dividendPre-demographic dividendPuerto RicoQatarRomaniaRussian FederationRwandaSamoaSan MarinoSao Tome and PrincipeSaudi ArabiaSenegalSerbiaSeychellesSierra LeoneSlovak RepublicSloveniaSmall statesSolomon IslandsSomaliaSouth AfricaSouth AsiaSouth Asia (IDA & IBRD)South SudanSpainSri LankaSt. Kitts and NevisSt. LuciaSt. Vincent and the GrenadinesSub-Saharan Africa Sub-Saharan Africa (excluding high income)Sub-Saharan Africa (IDA & IBRD countries)SudanSurinameSwazilandSwedenSwitzerlandSyrian Arab RepublicTajikistanTanzaniaThailandTimor-LesteTogoTongaTrinidad and TobagoTunisiaTurkeyTurkmenistanTuvaluUgandaUkraineUnited Arab EmiratesUnited KingdomUnited StatesUpper middle incomeUruguayUzbekistanVanuatuVenezuela, RBVietnamWest Bank and GazaWorldYemen, Rep.ZambiaZimbabwe Linha do tempo:
Nesta escala de tempo está apresentado um gráfico de 1974 ano até 2015 ano East Asia & Pacific. Dados de 1973 ano ausente. O número de observações reais por data: 42.
Fonte (nome):
Indicadores de desenvolvimento mundial
Fonte (organização):
United Nations Educational, Scientific, and Cultural Organization (UNESCO) Institute for Statistics.
Categorias:
Education, Gender
Foi atualizado:
23 abr 2017 ano
Indicadores de alterações dos valores ao longo dos anos
Mínimo:
95.34
1 jan 1974 ano
Máximo:
115.129
1 jan 1990 ano
Na data de observação
Valor
Mudança absoluta
A alteração em relação ao valor anterior
1 jan 1974 ano
95.34
+95.34
0.0%
1 jan 1975 ano
96.944
+1.604
1.68%
1 jan 1976 ano
103.485
+6.541
6.75%
1 jan 1977 ano
106.407
+2.922
2.82%
1 jan 1978 ano
104.285
-2.122
-1.99%
1 jan 1979 ano
101.187
-3.098
-2.97%
1 jan 1980 ano
100.522
-0.665
-0.66%
1 jan 1981 ano
101.51
+0.988
0.98%
1 jan 1982 ano
102.502
+0.992
0.98%
1 jan 1983 ano
102.277
-0.226
-0.22%
1 jan 1984 ano
102.506
+0.229
0.22%
1 jan 1985 ano
103.457
+0.951
0.93%
1 jan 1986 ano
106.527
+3.07
2.97%
1 jan 1987 ano
110.289
+3.762
3.53%
1 jan 1988 ano
113.35
+3.061
2.78%
1 jan 1989 ano
114.666
+1.316
1.16%
1 jan 1990 ano
115.129
+0.464
0.4%
1 jan 1991 ano
114.256
-0.874
-0.76%
1 jan 1992 ano
113.245
-1.011
-0.88%
1 jan 1993 ano
112.247
-0.998
-0.88%
1 jan 1994 ano
110.56
-1.687
-1.5%
1 jan 1995 ano
109.291
-1.269
-1.15%
1 jan 1996 ano
107.643
-1.648
-1.51%
1 jan 1997 ano
105.874
-1.768
-1.64%
1 jan 1998 ano
104.695
-1.18
-1.11%
1 jan 1999 ano
104.671
-0.023
-0.02%
1 jan 2000 ano
104.716
+0.045
0.04%
1 jan 2001 ano
105.183
+0.467
0.45%
1 jan 2002 ano
105.844
+0.661
0.63%
1 jan 2003 ano
107.268
+1.424
1.35%
1 jan 2004 ano
108.975
+1.707
1.59%
1 jan 2005 ano
105.999
-2.976
-2.73%
1 jan 2006 ano
102.404
-3.595
-3.39%
1 jan 2007 ano
103.181
+0.777
0.76%
1 jan 2008 ano
105.971
+2.79
2.7%
1 jan 2009 ano
107.841
+1.87
1.77%
1 jan 2010 ano
108.559
+0.717
0.67%
1 jan 2011 ano
108.766
+0.207
0.19%
1 jan 2012 ano
108.366
-0.401
-0.37%
1 jan 2013 ano
108.165
-0.2
-0.18%
1 jan 2014 ano
107.407
-0.758
-0.7%
1 jan 2015 ano
104.967
-2.44
-2.27%
Classificação de países por estatísticas atuais por anos


Comentários: