29
/pt/
pt
AIzaSyAYiBZKx7MnpbEhh9jyipgxe19OcubqV5w
April 1, 2024
48410
Middle East & North Africa
MEA
false
2
1
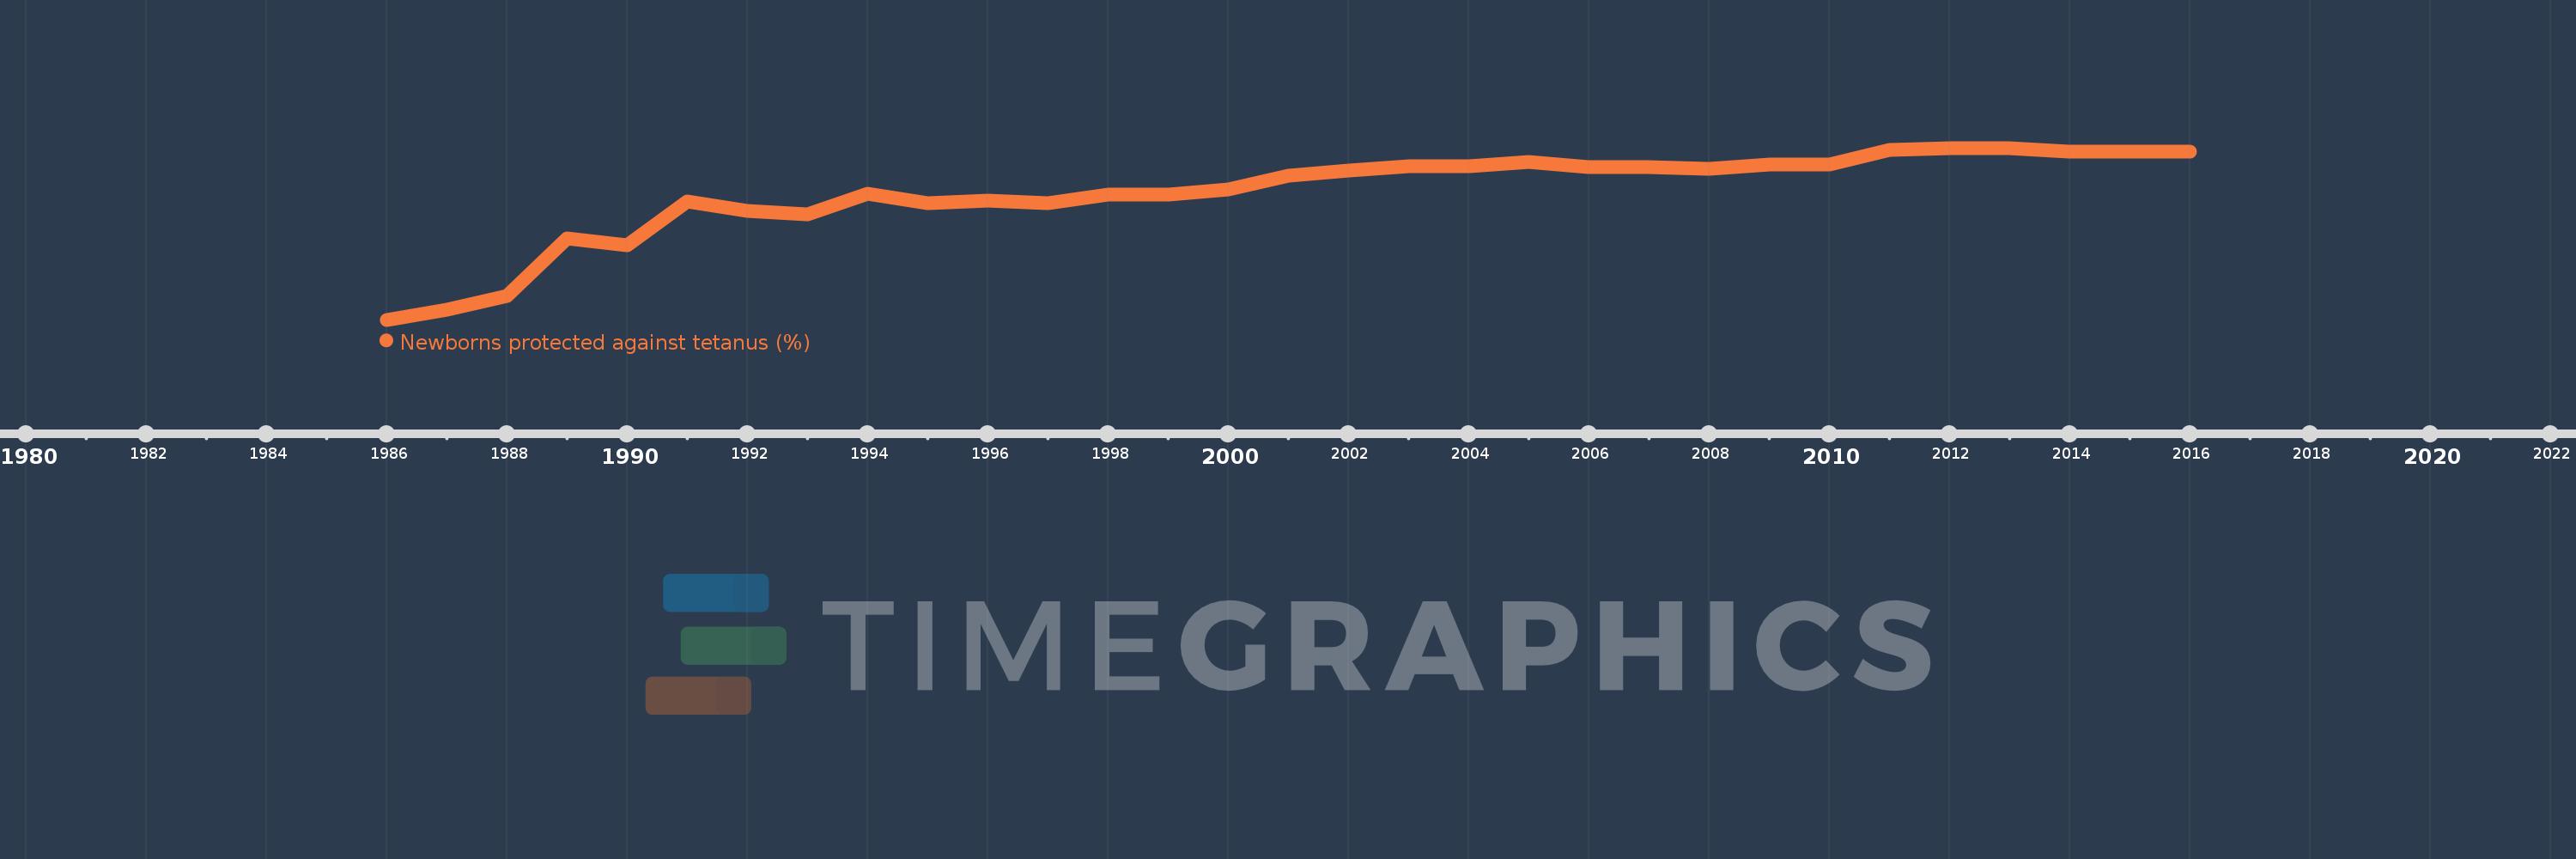
Newborns protected against tetanus (%)
2016,2015,2014,2013,2012,2011,2010,2009,2008,2007,2006,2005,2004,2003,2002,2001,2000,1999,1998,1997,1996,1995,1994,1993,1992,1991,1990,1989,1988,1987,1986
Estas estatísticas em outros países:
Linha do tempo:
Nesta escala de tempo está apresentado um gráfico de 1986 ano até 2016 ano Middle East & North Africa. Dados de 1985 ano ausente. O número de observações reais por data: 31.
Fonte (nome):
Indicadores de desenvolvimento mundial
Fonte (organização):
WHO and UNICEF (http://www.who.int/immunization/monitoring_surveillance/en/).
Categorias:
Health
Foi atualizado:
23 abr 2017 ano
Indicadores de alterações dos valores ao longo dos anos
Mínimo:
17.341
1 jan 1986 ano
Máximo:
86.974
1 jan 2012 ano
Na data de observação
Valor
Mudança absoluta
A alteração em relação ao valor anterior
1 jan 1986 ano
17.341
+17.341
0.0%
1 jan 1987 ano
21.488
+4.148
23.92%
1 jan 1988 ano
26.835
+5.347
24.88%
1 jan 1989 ano
50.391
+23.556
87.78%
1 jan 1990 ano
47.603
-2.788
-5.53%
1 jan 1991 ano
65.41
+17.806
37.41%
1 jan 1992 ano
61.413
-3.996
-6.11%
1 jan 1993 ano
60.225
-1.188
-1.93%
1 jan 1994 ano
68.401
+8.176
13.58%
1 jan 1995 ano
64.527
-3.874
-5.66%
1 jan 1996 ano
65.622
+1.095
1.7%
1 jan 1997 ano
64.616
-1.006
-1.53%
1 jan 1998 ano
68.023
+3.407
5.27%
1 jan 1999 ano
68.15
+0.127
0.19%
1 jan 2000 ano
70.221
+2.07
3.04%
1 jan 2001 ano
75.725
+5.505
7.84%
1 jan 2002 ano
77.772
+2.047
2.7%
1 jan 2003 ano
79.688
+1.916
2.46%
1 jan 2004 ano
79.73
+0.042
0.05%
1 jan 2005 ano
81.365
+1.635
2.05%
1 jan 2006 ano
79.036
-2.329
-2.86%
1 jan 2007 ano
79.215
+0.179
0.23%
1 jan 2008 ano
78.604
-0.611
-0.77%
1 jan 2009 ano
80.12
+1.517
1.93%
1 jan 2010 ano
80.138
+0.017
0.02%
1 jan 2011 ano
86.242
+6.104
7.62%
1 jan 2012 ano
86.974
+0.732
0.85%
1 jan 2013 ano
86.949
-0.025
-0.03%
1 jan 2014 ano
85.499
-1.451
-1.67%
1 jan 2015 ano
85.535
+0.036
0.04%
1 jan 2016 ano
85.397
-0.137
-0.16%
Classificação de países por estatísticas atuais por anos


Comentários: