29
/pt/
pt
AIzaSyAYiBZKx7MnpbEhh9jyipgxe19OcubqV5w
April 1, 2024
188209
Malaysia
MYS
true
2
1
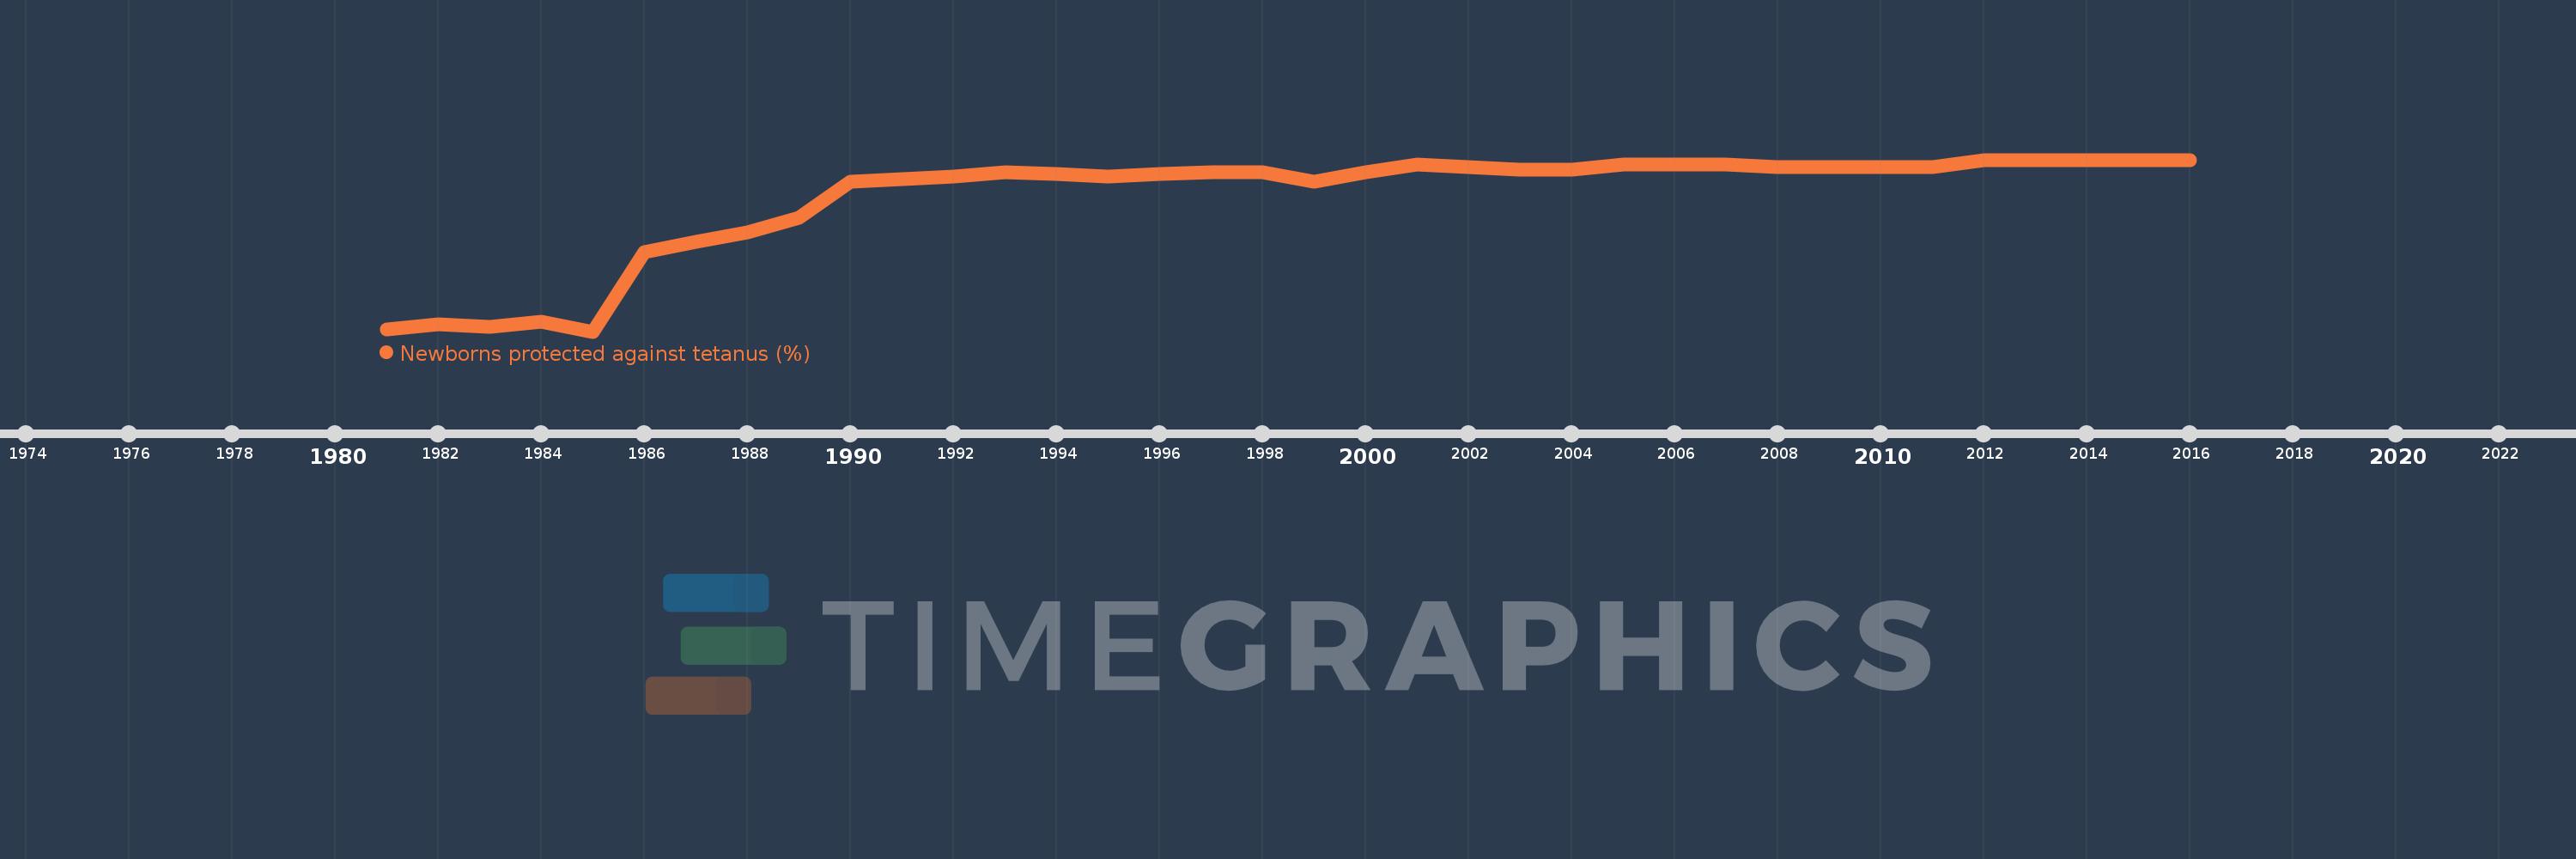
Newborns protected against tetanus (%)
2016,2015,2014,2013,2012,2011,2010,2009,2008,2007,2006,2005,2004,2003,2002,2001,2000,1999,1998,1997,1996,1995,1994,1993,1992,1991,1990,1989,1988,1987,1986,1985,1984,1983,1982,1981
Estas estatísticas em outros países:
Linha do tempo:
Nesta escala de tempo está apresentado um gráfico de 1981 ano até 2016 ano Malaysia. Dados de 1980 ano ausente. O número de observações reais por data: 36.
Fonte (nome):
Indicadores de desenvolvimento mundial
Fonte (organização):
WHO and UNICEF (http://www.who.int/immunization/monitoring_surveillance/en/).
Categorias:
Health
Foi atualizado:
23 abr 2017 ano
Indicadores de alterações dos valores ao longo dos anos
Mínimo:
19.0
1 jan 1985 ano
Máximo:
90.0
1 jan 2012 ano
Na data de observação
Valor
Mudança absoluta
A alteração em relação ao valor anterior
1 jan 1981 ano
20.0
+20.0
0.0%
1 jan 1982 ano
22.0
+2.0
10.0%
1 jan 1983 ano
21.0
-1.0
-4.55%
1 jan 1984 ano
23.0
+2.0
9.52%
1 jan 1985 ano
19.0
-4.0
-17.39%
1 jan 1986 ano
52.0
+33.0
173.68%
1 jan 1987 ano
56.0
+4.0
7.69%
1 jan 1988 ano
60.0
+4.0
7.14%
1 jan 1989 ano
66.0
+6.0
10.0%
1 jan 1990 ano
81.0
+15.0
22.73%
1 jan 1991 ano
82.0
+1.0
1.23%
1 jan 1992 ano
83.0
+1.0
1.22%
1 jan 1993 ano
85.0
+2.0
2.41%
1 jan 1994 ano
84.0
-1.0
-1.18%
1 jan 1995 ano
83.0
-1.0
-1.19%
1 jan 1996 ano
84.0
+1.0
1.2%
1 jan 1997 ano
85.0
+1.0
1.19%
1 jan 1998 ano
85.0
0.0
0.0%
1 jan 1999 ano
81.0
-4.0
-4.71%
1 jan 2000 ano
85.0
+4.0
4.94%
1 jan 2001 ano
88.0
+3.0
3.53%
1 jan 2002 ano
87.0
-1.0
-1.14%
1 jan 2003 ano
86.0
-1.0
-1.15%
1 jan 2004 ano
86.0
0.0
0.0%
1 jan 2005 ano
88.0
+2.0
2.33%
1 jan 2006 ano
88.0
0.0
0.0%
1 jan 2007 ano
88.0
0.0
0.0%
1 jan 2008 ano
87.0
-1.0
-1.14%
1 jan 2009 ano
87.0
0.0
0.0%
1 jan 2010 ano
87.0
0.0
0.0%
1 jan 2011 ano
87.0
0.0
0.0%
1 jan 2012 ano
90.0
+3.0
3.45%
1 jan 2013 ano
90.0
0.0
0.0%
1 jan 2014 ano
90.0
0.0
0.0%
1 jan 2015 ano
90.0
0.0
0.0%
1 jan 2016 ano
90.0
0.0
0.0%
Classificação de países por estatísticas atuais por anos


Comentários: