29
/pt/
pt
AIzaSyAYiBZKx7MnpbEhh9jyipgxe19OcubqV5w
April 1, 2024
47710
Lower middle income
LMC
false
2
1
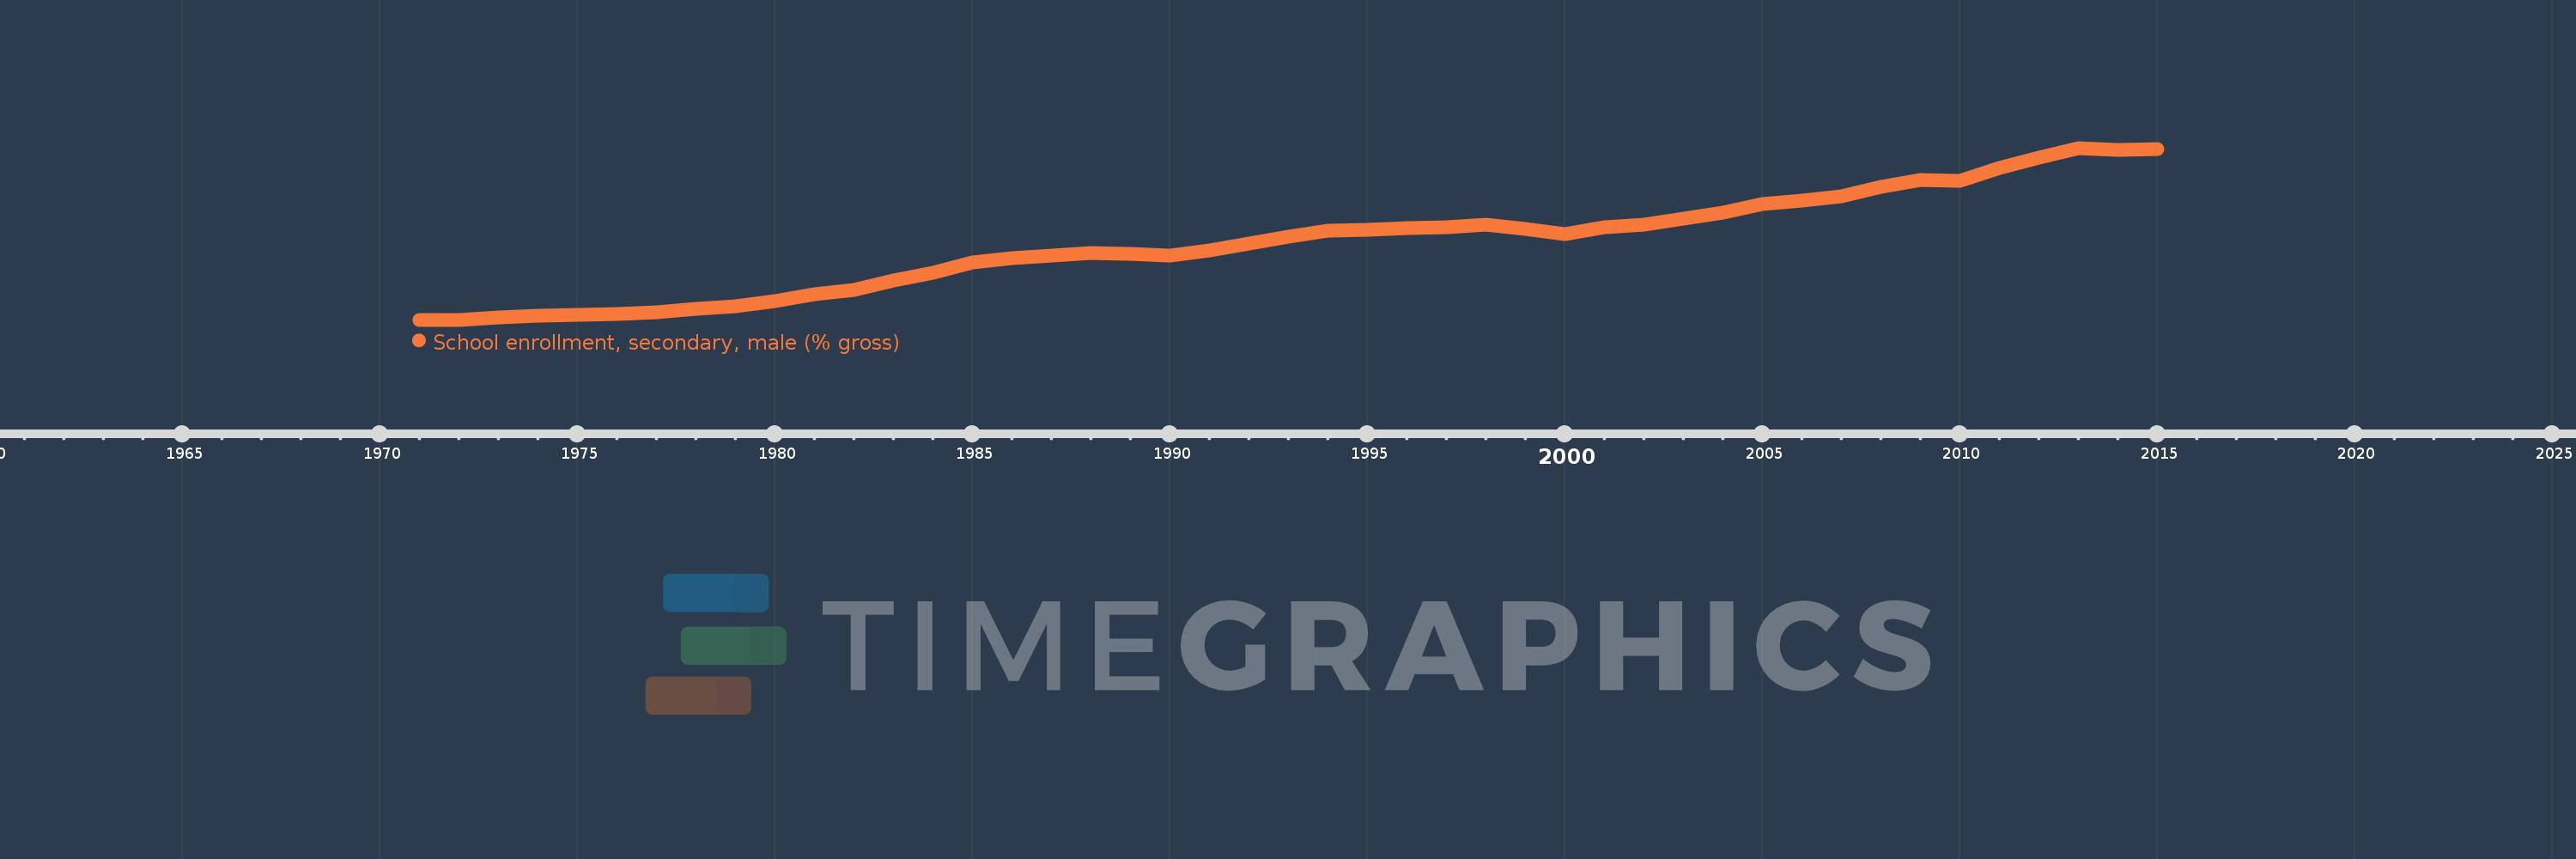
School enrollment, secondary, male (% gross)
2015,2014,2013,2012,2011,2010,2009,2008,2007,2006,2005,2004,2003,2002,2001,2000,1999,1998,1997,1996,1995,1994,1993,1992,1991,1990,1989,1988,1987,1986,1985,1984,1983,1982,1981,1980,1979,1978,1977,1976,1975,1974,1973,1972,1971
Estas estatísticas em outros países:
AfghanistanAlbaniaAlgeriaAndorraAngolaAntigua and BarbudaArab WorldArgentinaArmeniaArubaAustraliaAustriaAzerbaijanBahamas, TheBahrainBangladeshBarbadosBelarusBelgiumBelizeBeninBermudaBhutanBoliviaBosnia and HerzegovinaBotswanaBrazilBrunei DarussalamBulgariaBurkina FasoBurundiCabo VerdeCambodiaCameroonCanadaCaribbean small statesCentral African RepublicCentral Europe and the BalticsChadChileChinaColombiaComorosCongo, Dem. Rep.Congo, Rep.Costa RicaCote d'IvoireCroatiaCubaCuracaoCyprusCzech RepublicDenmarkDjiboutiDominicaDominican RepublicEarly-demographic dividendEast Asia & PacificEast Asia & Pacific (excluding high income)East Asia & Pacific (IDA & IBRD countries)EcuadorEgypt, Arab Rep.El SalvadorEquatorial GuineaEritreaEstoniaEthiopiaEuro areaEurope & Central AsiaEurope & Central Asia (excluding high income)Europe & Central Asia (IDA & IBRD countries)European UnionFijiFinlandFragile and conflict affected situationsFranceGabonGambia, TheGeorgiaGermanyGhanaGreeceGrenadaGuatemalaGuineaGuinea-BissauGuyanaHeavily indebted poor countries (HIPC)High incomeHondurasHong Kong SAR, ChinaHungaryIBRD onlyIcelandIDA & IBRD totalIDA blendIDA onlyIDA totalIndiaIndonesiaIran, Islamic Rep.IraqIrelandIsraelItalyJamaicaJapanJordanKazakhstanKenyaKiribatiKorea, Dem. People’s Rep.Korea, Rep.KuwaitKyrgyz RepublicLao PDRLate-demographic dividendLatin America & Caribbean Latin America & Caribbean (excluding high income)Latin America & the Caribbean (IDA & IBRD countries)LatviaLeast developed countries: UN classificationLebanonLesothoLiberiaLibyaLiechtensteinLithuaniaLow & middle incomeLow incomeLower middle incomeLuxembourgMacao SAR, ChinaMacedonia, FYRMadagascarMalawiMaldivesMaliMaltaMarshall IslandsMauritaniaMauritiusMexicoMicronesia, Fed. Sts.Middle East & North AfricaMiddle East & North Africa (excluding high income)Middle East & North Africa (IDA & IBRD countries)Middle incomeMoldovaMongoliaMontenegroMoroccoMozambiqueMyanmarNamibiaNauruNepalNetherlandsNew ZealandNicaraguaNigerNigeriaNorth AmericaNorwayOECD membersOmanOther small statesPacific island small statesPakistanPalauPanamaPapua New GuineaParaguayPeruPhilippinesPolandPortugalPost-demographic dividendPre-demographic dividendPuerto RicoQatarRomaniaRussian FederationRwandaSamoaSan MarinoSao Tome and PrincipeSaudi ArabiaSenegalSerbiaSeychellesSierra LeoneSlovak RepublicSloveniaSmall statesSolomon IslandsSomaliaSouth AfricaSouth AsiaSouth Asia (IDA & IBRD)SpainSri LankaSt. Kitts and NevisSt. LuciaSt. Vincent and the GrenadinesSub-Saharan Africa Sub-Saharan Africa (excluding high income)Sub-Saharan Africa (IDA & IBRD countries)SudanSurinameSwazilandSwedenSwitzerlandSyrian Arab RepublicTajikistanTanzaniaThailandTimor-LesteTogoTongaTrinidad and TobagoTunisiaTurkeyTurkmenistanTuvaluUgandaUkraineUnited Arab EmiratesUnited KingdomUnited StatesUpper middle incomeUruguayUzbekistanVanuatuVenezuela, RBVietnamWest Bank and GazaWorldYemen, Rep.ZambiaZimbabwe Linha do tempo:
Nesta escala de tempo está apresentado um gráfico de 1971 ano até 2015 ano Lower middle income. Dados de 1970 ano ausente. O número de observações reais por data: 45.
Fonte (nome):
Indicadores de desenvolvimento mundial
Fonte (organização):
United Nations Educational, Scientific, and Cultural Organization (UNESCO) Institute for Statistics.
Categorias:
Education, Gender
Foi atualizado:
23 abr 2017 ano
Indicadores de alterações dos valores ao longo dos anos
Mínimo:
34.117
1 jan 1972 ano
Máximo:
66.195
1 jan 2013 ano
Na data de observação
Valor
Mudança absoluta
A alteração em relação ao valor anterior
1 jan 1971 ano
34.138
+34.138
0.0%
1 jan 1972 ano
34.117
-0.021
-0.06%
1 jan 1973 ano
34.538
+0.421
1.23%
1 jan 1974 ano
34.855
+0.317
0.92%
1 jan 1975 ano
34.962
+0.107
0.31%
1 jan 1976 ano
35.268
+0.306
0.87%
1 jan 1977 ano
35.46
+0.193
0.55%
1 jan 1978 ano
36.143
+0.683
1.93%
1 jan 1979 ano
36.693
+0.549
1.52%
1 jan 1980 ano
37.591
+0.899
2.45%
1 jan 1981 ano
38.814
+1.222
3.25%
1 jan 1982 ano
39.746
+0.932
2.4%
1 jan 1983 ano
41.378
+1.633
4.11%
1 jan 1984 ano
42.914
+1.536
3.71%
1 jan 1985 ano
44.755
+1.841
4.29%
1 jan 1986 ano
45.629
+0.874
1.95%
1 jan 1987 ano
46.133
+0.504
1.1%
1 jan 1988 ano
46.549
+0.415
0.9%
1 jan 1989 ano
46.465
-0.083
-0.18%
1 jan 1990 ano
46.166
-0.299
-0.64%
1 jan 1991 ano
47.12
+0.953
2.06%
1 jan 1992 ano
48.373
+1.253
2.66%
1 jan 1993 ano
49.572
+1.199
2.48%
1 jan 1994 ano
50.704
+1.132
2.28%
1 jan 1995 ano
50.983
+0.279
0.55%
1 jan 1996 ano
51.209
+0.226
0.44%
1 jan 1997 ano
51.363
+0.154
0.3%
1 jan 1998 ano
51.926
+0.563
1.1%
1 jan 1999 ano
51.082
-0.844
-1.62%
1 jan 2000 ano
50.157
-0.925
-1.81%
1 jan 2001 ano
51.404
+1.246
2.49%
1 jan 2002 ano
51.845
+0.441
0.86%
1 jan 2003 ano
53.061
+1.216
2.35%
1 jan 2004 ano
54.184
+1.122
2.12%
1 jan 2005 ano
55.651
+1.468
2.71%
1 jan 2006 ano
56.417
+0.766
1.38%
1 jan 2007 ano
57.221
+0.804
1.42%
1 jan 2008 ano
58.941
+1.72
3.01%
1 jan 2009 ano
60.141
+1.2
2.04%
1 jan 2010 ano
60.071
-0.07
-0.12%
1 jan 2011 ano
62.403
+2.332
3.88%
1 jan 2012 ano
64.336
+1.934
3.1%
1 jan 2013 ano
66.195
+1.858
2.89%
1 jan 2014 ano
65.866
-0.329
-0.5%
1 jan 2015 ano
65.931
+0.065
0.1%
Classificação de países por estatísticas atuais por anos


Comentários: