29
/pt/
pt
AIzaSyAYiBZKx7MnpbEhh9jyipgxe19OcubqV5w
April 1, 2024
153061
Hungary
HUN
true
2
1
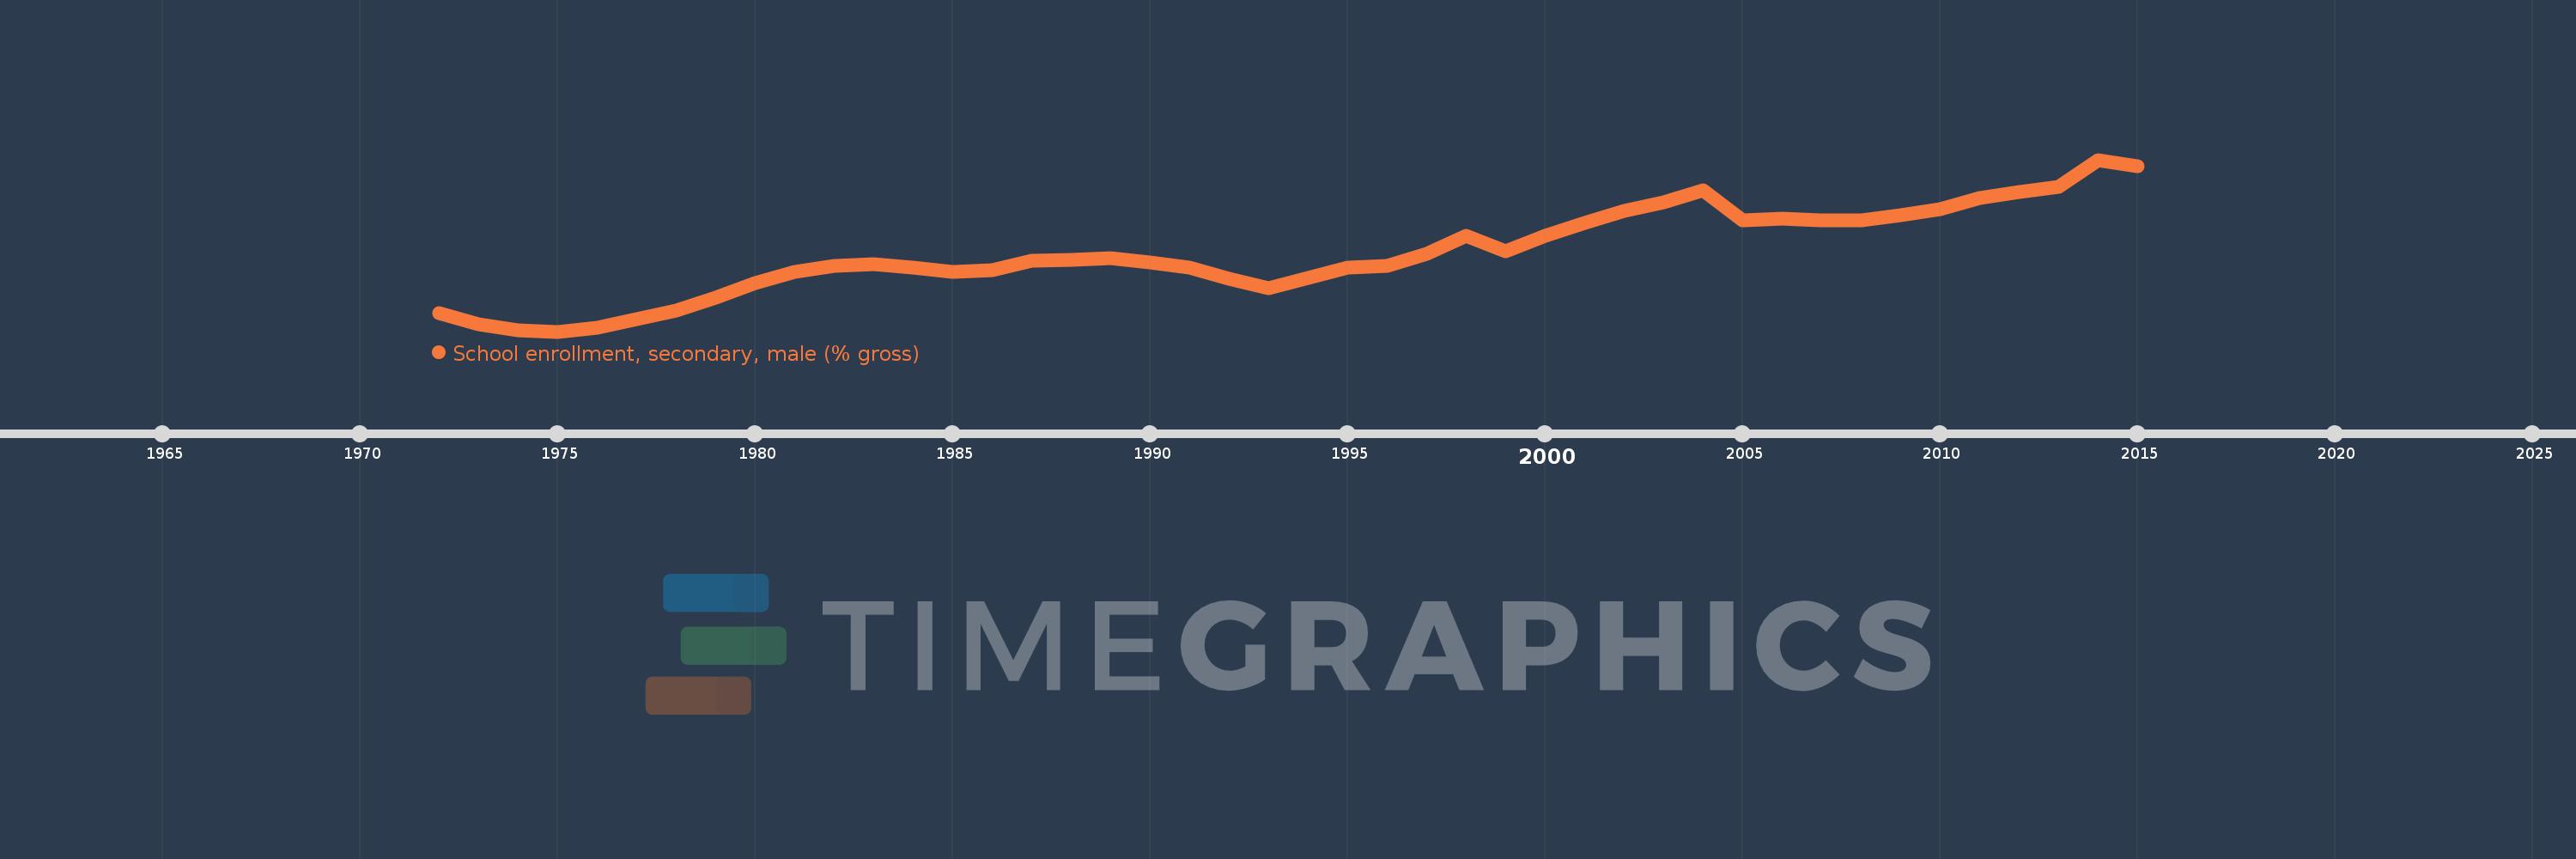
School enrollment, secondary, male (% gross)
2015,2014,2013,2012,2011,2010,2009,2008,2007,2006,2005,2004,2003,2002,2001,2000,1999,1998,1997,1996,1995,1993,1992,1991,1990,1989,1988,1987,1986,1985,1984,1983,1982,1981,1980,1979,1978,1977,1976,1975,1974,1973,1972
Estas estatísticas em outros países:
AfghanistanAlbaniaAlgeriaAndorraAngolaAntigua and BarbudaArab WorldArgentinaArmeniaArubaAustraliaAustriaAzerbaijanBahamas, TheBahrainBangladeshBarbadosBelarusBelgiumBelizeBeninBermudaBhutanBoliviaBosnia and HerzegovinaBotswanaBrazilBrunei DarussalamBulgariaBurkina FasoBurundiCabo VerdeCambodiaCameroonCanadaCaribbean small statesCentral African RepublicCentral Europe and the BalticsChadChileChinaColombiaComorosCongo, Dem. Rep.Congo, Rep.Costa RicaCote d'IvoireCroatiaCubaCuracaoCyprusCzech RepublicDenmarkDjiboutiDominicaDominican RepublicEarly-demographic dividendEast Asia & PacificEast Asia & Pacific (excluding high income)East Asia & Pacific (IDA & IBRD countries)EcuadorEgypt, Arab Rep.El SalvadorEquatorial GuineaEritreaEstoniaEthiopiaEuro areaEurope & Central AsiaEurope & Central Asia (excluding high income)Europe & Central Asia (IDA & IBRD countries)European UnionFijiFinlandFragile and conflict affected situationsFranceGabonGambia, TheGeorgiaGermanyGhanaGreeceGrenadaGuatemalaGuineaGuinea-BissauGuyanaHeavily indebted poor countries (HIPC)High incomeHondurasHong Kong SAR, ChinaHungaryIBRD onlyIcelandIDA & IBRD totalIDA blendIDA onlyIDA totalIndiaIndonesiaIran, Islamic Rep.IraqIrelandIsraelItalyJamaicaJapanJordanKazakhstanKenyaKiribatiKorea, Dem. People’s Rep.Korea, Rep.KuwaitKyrgyz RepublicLao PDRLate-demographic dividendLatin America & Caribbean Latin America & Caribbean (excluding high income)Latin America & the Caribbean (IDA & IBRD countries)LatviaLeast developed countries: UN classificationLebanonLesothoLiberiaLibyaLiechtensteinLithuaniaLow & middle incomeLow incomeLower middle incomeLuxembourgMacao SAR, ChinaMacedonia, FYRMadagascarMalawiMaldivesMaliMaltaMarshall IslandsMauritaniaMauritiusMexicoMicronesia, Fed. Sts.Middle East & North AfricaMiddle East & North Africa (excluding high income)Middle East & North Africa (IDA & IBRD countries)Middle incomeMoldovaMongoliaMontenegroMoroccoMozambiqueMyanmarNamibiaNauruNepalNetherlandsNew ZealandNicaraguaNigerNigeriaNorth AmericaNorwayOECD membersOmanOther small statesPacific island small statesPakistanPalauPanamaPapua New GuineaParaguayPeruPhilippinesPolandPortugalPost-demographic dividendPre-demographic dividendPuerto RicoQatarRomaniaRussian FederationRwandaSamoaSan MarinoSao Tome and PrincipeSaudi ArabiaSenegalSerbiaSeychellesSierra LeoneSlovak RepublicSloveniaSmall statesSolomon IslandsSomaliaSouth AfricaSouth AsiaSouth Asia (IDA & IBRD)SpainSri LankaSt. Kitts and NevisSt. LuciaSt. Vincent and the GrenadinesSub-Saharan Africa Sub-Saharan Africa (excluding high income)Sub-Saharan Africa (IDA & IBRD countries)SudanSurinameSwazilandSwedenSwitzerlandSyrian Arab RepublicTajikistanTanzaniaThailandTimor-LesteTogoTongaTrinidad and TobagoTunisiaTurkeyTurkmenistanTuvaluUgandaUkraineUnited Arab EmiratesUnited KingdomUnited StatesUpper middle incomeUruguayUzbekistanVanuatuVenezuela, RBVietnamWest Bank and GazaWorldYemen, Rep.ZambiaZimbabwe Linha do tempo:
Nesta escala de tempo está apresentado um gráfico de 1972 ano até 2015 ano Hungary. Dados de 1971 ano ausente. O número de observações reais por data: 43.
Fonte (nome):
Indicadores de desenvolvimento mundial
Fonte (organização):
United Nations Educational, Scientific, and Cultural Organization (UNESCO) Institute for Statistics.
Categorias:
Education, Gender
Foi atualizado:
23 abr 2017 ano
Indicadores de alterações dos valores ao longo dos anos
Mínimo:
74.767
1 jan 1975 ano
Máximo:
108.078
1 jan 2014 ano
Na data de observação
Valor
Mudança absoluta
A alteração em relação ao valor anterior
1 jan 1972 ano
78.417
+78.417
0.0%
1 jan 1973 ano
76.229
-2.188
-2.79%
1 jan 1974 ano
74.976
-1.253
-1.64%
1 jan 1975 ano
74.767
-0.209
-0.28%
1 jan 1976 ano
75.563
+0.796
1.06%
1 jan 1977 ano
77.133
+1.57
2.08%
1 jan 1978 ano
78.891
+1.758
2.28%
1 jan 1979 ano
81.281
+2.39
3.03%
1 jan 1980 ano
84.248
+2.968
3.65%
1 jan 1981 ano
86.296
+2.048
2.43%
1 jan 1982 ano
87.467
+1.171
1.36%
1 jan 1983 ano
87.783
+0.316
0.36%
1 jan 1984 ano
87.229
-0.554
-0.63%
1 jan 1985 ano
86.313
-0.916
-1.05%
1 jan 1986 ano
86.664
+0.351
0.41%
1 jan 1987 ano
88.438
+1.774
2.05%
1 jan 1988 ano
88.74
+0.302
0.34%
1 jan 1989 ano
89.021
+0.281
0.32%
1 jan 1990 ano
88.209
-0.812
-0.91%
1 jan 1991 ano
87.105
-1.104
-1.25%
1 jan 1992 ano
85.041
-2.064
-2.37%
1 jan 1993 ano
83.116
-1.925
-2.26%
1 jan 1995 ano
87.13
+4.014
4.83%
1 jan 1996 ano
87.581
+0.451
0.52%
1 jan 1997 ano
89.886
+2.305
2.63%
1 jan 1998 ano
93.324
+3.438
3.82%
1 jan 1999 ano
90.357
-2.967
-3.18%
1 jan 2000 ano
93.257
+2.9
3.21%
1 jan 2001 ano
95.817
+2.561
2.75%
1 jan 2002 ano
98.16
+2.343
2.45%
1 jan 2003 ano
99.824
+1.664
1.7%
1 jan 2004 ano
102.218
+2.393
2.4%
1 jan 2005 ano
96.404
-5.814
-5.69%
1 jan 2006 ano
96.666
+0.263
0.27%
1 jan 2007 ano
96.355
-0.311
-0.32%
1 jan 2008 ano
96.397
+0.042
0.04%
1 jan 2009 ano
97.402
+1.004
1.04%
1 jan 2010 ano
98.524
+1.122
1.15%
1 jan 2011 ano
100.715
+2.192
2.22%
1 jan 2012 ano
101.815
+1.1
1.09%
1 jan 2013 ano
102.878
+1.063
1.04%
1 jan 2014 ano
108.078
+5.2
5.05%
1 jan 2015 ano
106.868
-1.21
-1.12%
Classificação de países por estatísticas atuais por anos


Comentários: